Figures & data
Figure 1 Average of systolic and diastolic blood pressure values.
Notes: Blood pressure (BP) values are presented as the mean per day. Systolic BP is shown as a solid line. Diastolic BP is shown as a dashed line. The BP was not measured on day 19.
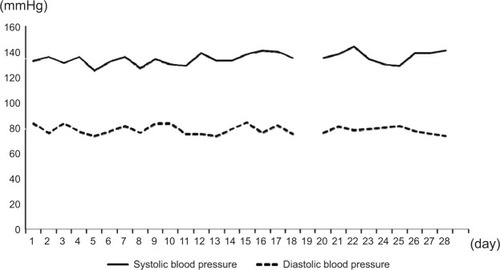
Figure 2 Comparison of average daytime and nighttime blood pressure during the monitoring periods.
Notes: Blood pressure (BP) values are presented as the mean ± standard deviation. The mean values for daytime and nighttime systolic BP were 131 mmHg and 137 mmHg, respectively, and diastolic BP was 78 mmHg.
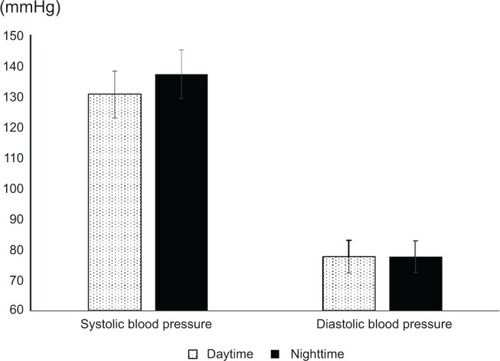
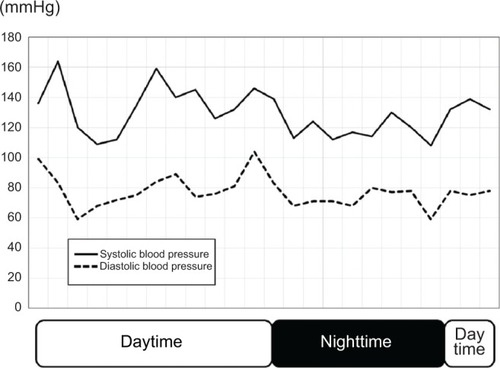
Figure 3 Blood pressure (BP) during ambulatory blood pressure monitoring periods.
Notes: Nighttime was defined as the actual sleep time based on the patient’s diary. The mean daytime or nighttime BPs were 135/80 mmHg and 120/73 mmHg, respectively.