
Figures & data
Figure 1 Graphical representation of the economic model.
Abbreviation: BCAR, biopsy-confirmed acute rejection.
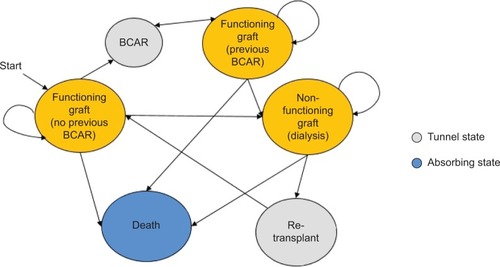
Table 1 Base case results (25 years, 3.5% discount rate, adverse events, half-cycle correction) (individual costs [£] and costs [£]/QALY)
Figure 2 Cost-effectiveness plots for all comparator products compared with Prograf (Astellas Pharma UK Ltd., Chertsey, UK).
Abbreviation: QALY, quality adjusted life-years.
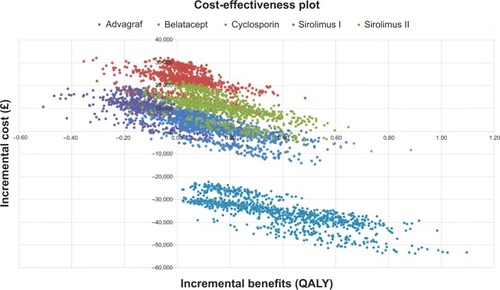
Figure 3 Cost-effectiveness acceptability curve for Prograf (Astellas Pharma UK Ltd., Chertsey, UK) versus cyclosporin.
Abbreviation: QALY, quality adjusted life-years.
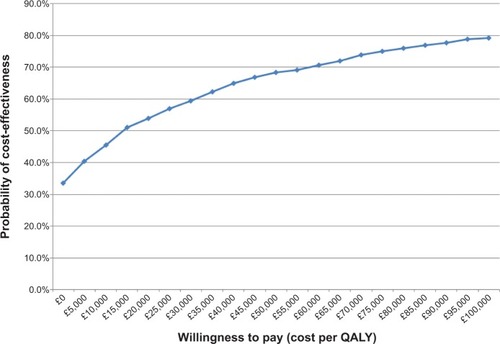
Table 2 Sensitivity analysis results: ICERs (Prograf versus comparators) expressed as costs (£) per QALY
Figure 4 Tornado diagram of key variables for Prograf versus Advagraf (ICER [cost/QALY]).
Notes: Prolonged release tacrolimus: Advagraf; immediate release tacrolimus: Prograf.
Abbreviations: CAPD, continuous ambulatory peritoneal dialysis; HD, hemodialysis; QALY, quality adjusted life-years; ICER, incremental cost-effectiveness ratio.
Abbreviations: CAPD, continuous ambulatory peritoneal dialysis; HD, hemodialysis; QALY, quality adjusted life-years; ICER, incremental cost-effectiveness ratio.
![Figure 4 Tornado diagram of key variables for Prograf versus Advagraf (ICER [cost/QALY]).](/cms/asset/f22563f3-4f83-4ef7-a142-f6fdfffd383d/dppa_a_69461_f0004_c.jpg)
Table S1 Unit costs (£)
Table S2 Survival data
Table S3 Utility values