Figures & data
Table 1 Demographics and wear times of overweight (defined by BMI percentile 90–96) children and adolescents undergoing orthodontic therapy
Table 2 Demographics and wear times of obese (BMI percentile 97<99.5) and severely obese (≥99.5) (defined by BMI percentile) children and adolescents undergoing orthodontic therapy
Figure 1 BMIs of 21 overweight patients (patient numbers 1–21) at the beginning of treatment and at the second measurement, 6–35 months later.
Notes: Black column: beginning of treatment; gray column: second measurement (6–35 months later). Months between first and second BMI evaluations are given in the second line.
Abbreviation: BMI, body mass index.
Abbreviation: BMI, body mass index.
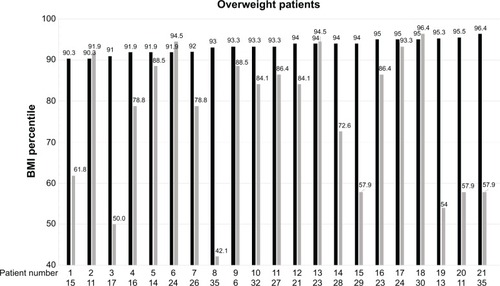
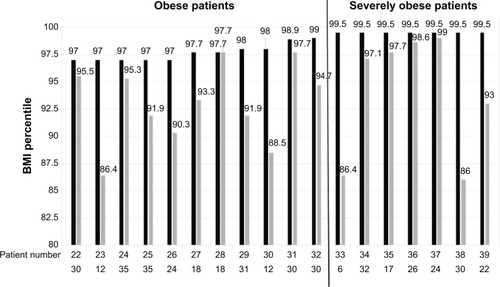
Figure 2 BMIs of eleven obese (patient numbers 22–32) and seven severely obese (patient numbers 33–39) patients at the beginning of treatment and at the second measurement, 6–35 months later.
Notes: Black column: beginning of treatment; gray column: second measurement (6–35 months later). Months between first and second BMI evaluation are given in the second line.
Abbreviation: BMI, body mass index.
Abbreviation: BMI, body mass index.