
Figures & data
Figure 1 Macroscopic calcification of bioprosthetic leaflet samples, stained with hematoxylin-eosin, with original magnification ×100. The two figures (A and B) show the morphology of calcification.
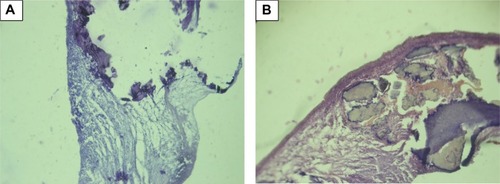
Figure 2 Macroscopic calcification of bioprosthetic leaflet samples, stained with Van Gison, with original magnification ×100. The two panels (A and B) show the morphology of calcification.
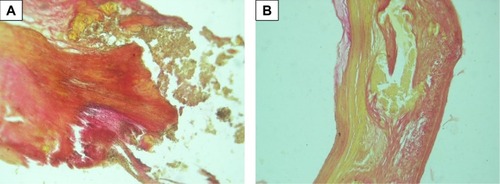
Figure 3 Scanning electron microscopy. Large calcified lumps. Backscatter electron imaging. Scale bar −100 microns.
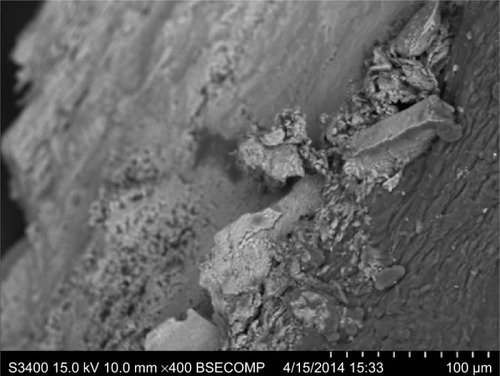
Figure 4 Scanning electron microscopy. Primary tissue degeneration with calcification. Backscatter electron imaging. Scale bar −200 microns.
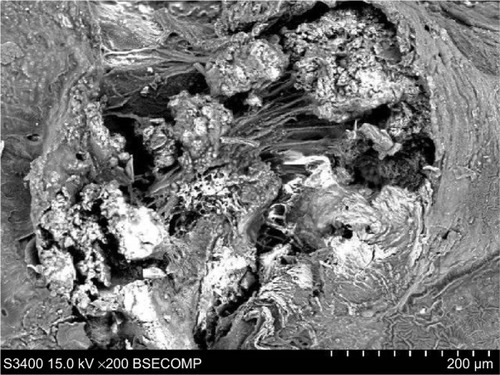
Figure 5 Scanning electron microscopy. Primary tissue degeneration with calcification. Secondary electron imaging. Scale bar −300 microns.
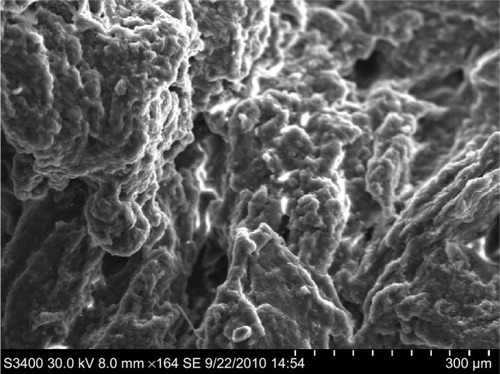
Figure 6 Micro-samples of bioprosthetic leaflet with endocarditis, stained with hematoxylin-eosin. Leuko-, lymphocytic infiltrates are visualized. Original magnification ×100. The two panels (A and B) show the morphology of calcification.
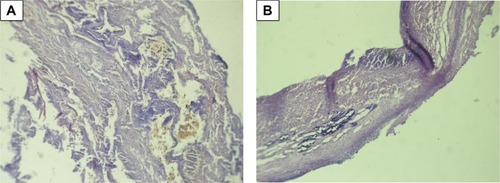
Figure 7 Micro-samples of bioprosthetic leaflet with endocarditis, stained with Van Gison. Original magnification ×100.
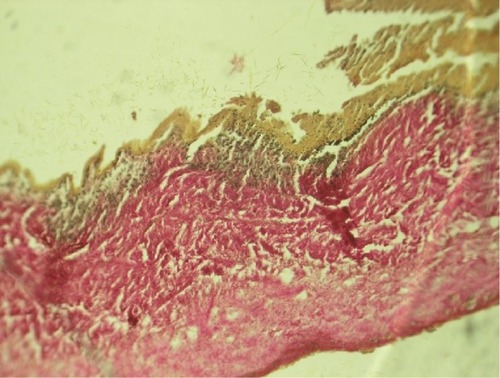
Figure 8 Scanning electron microscopy. Bacteria colonies in fibrin capsules. Secondary electron imaging. Scale bar −200 microns.
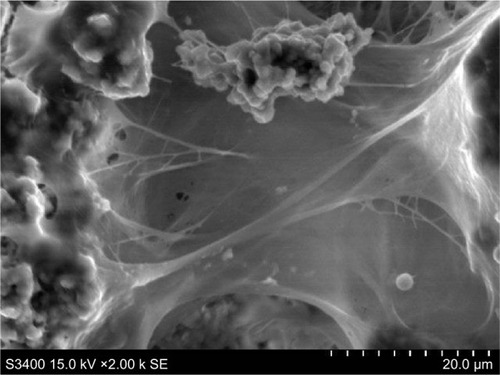
Figure 9 Micro-samples of bioprosthetic leaflet, stained with hematoxylin-eosin. Calcium deposits, leukocytic infiltrates and bacteria colonies are visualized. Original magnification ×400.
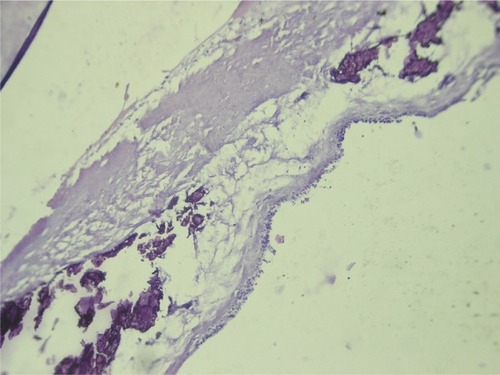
Table 1 Types of dysfunction according to histological and electron microscopic studies of explanted bioprostheses
Table 2 Clinical data of xenoaortic valve recipients
Table 3 Indicators of calcium–phosphorus metabolism in xenoaortic valve recipients
Table 4 Nonspecific inflammatory markers in xenoaortic valves
Table 5 Correlations between calcium–phosphorus metabolism and nonspecific inflammatory markers