
Figures & data
Figure 1 Difference in tension before intervention and during intervention, with and without premedication.
Notes: Patients were categorized in three groups depending on the tension level before the intervention (low: 0–3; medium: 4–7; high: 8–10). N is the number of patients; “No” indicates patients without premedication; “Yes” indicates patients with premedication. The short dashes within the boxes indicate the mean, and the broad lines indicate the median. Tension is measured by visual analog scale (VAS; 0–10). The circle indicates outlier (>1.5× IQR).
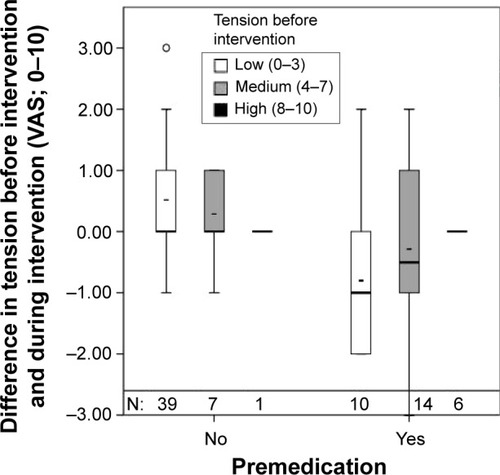
Figure 2 Patients’ self-assessment of the level of tension compared with the estimation by the physician (with and without premedication, VAS; 0–10).
Abbreviation: VAS, visual analog scale.
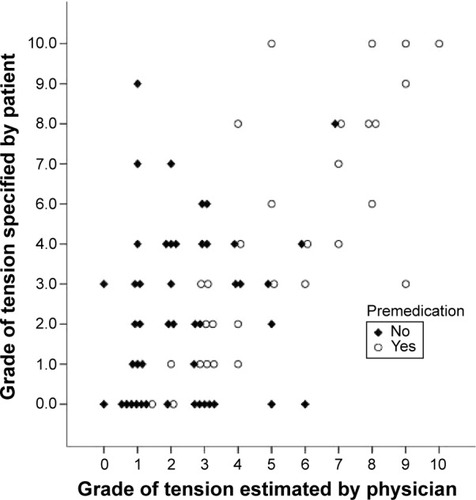
Figure 3 Patients’ satisfaction (VAS 0–10) in respect of the grade of tension (VAS ≤5/10 or >5/10) with and without premedication.
Notes: The circle indicates outlier (>1.5× IQR); the star indicates far outlier (>3× IQR).
Abbreviations: IQR, interquartile range; VAS, visual analog scale.
Abbreviations: IQR, interquartile range; VAS, visual analog scale.
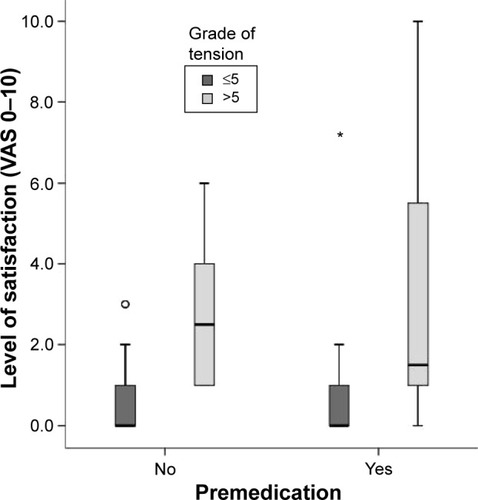
Figure 4 Intensity of pain during the procedure (VAS; 0–10) with and without premedication.
Notes: The circles indicate outlier (>1.5× IQR); the star indicates far outlier (>3× IQR).
Abbreviations: IQR, interquartile range; VAS, visual analog scale.
Abbreviations: IQR, interquartile range; VAS, visual analog scale.
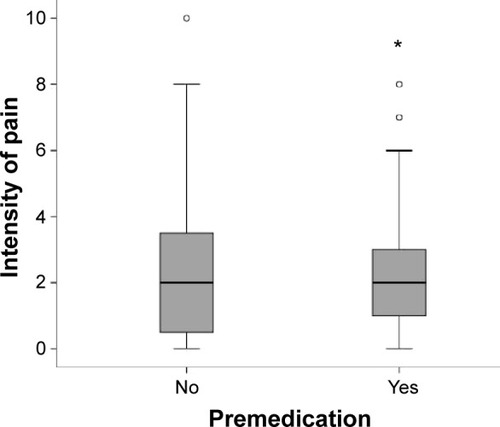
Table 1 Summary of results dependent on premedication administration