
Figures & data
Table 1 Health problems disclosed by the STEP assessment: prevalence of problems and type of patient burden ratings
Table 2 Assignment of patient ratings into clusters
Figure 1 Proportions of burden clusters (“0”, “1”, “2”, “3”) for each health problem.
Notes: The stacked bars for each health problem represent the proportion of patients in each burden cluster (0–3). Burden clusters are as follows: red: “3” = important, affecting, and limiting in daily activities; orange: “2” = important and emotionally affecting; dark green: “1” = only important; green: “0” = neither important, nor affecting, nor limiting in activities. *Clusters from dual ratings. **Only importance rating (yes/no).
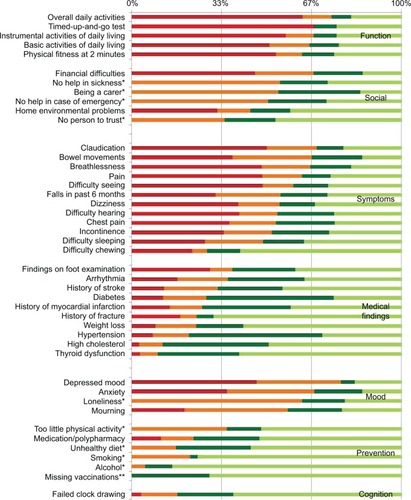
Table 3 Multilevel logistic regression model: predictors of a perceived high burden