
Figures & data
Table 1 Survey questionnaires
Table 2 Age-stratified patient characteristics
Table 3 Age-stratified analysis of the survey response rate
Table 4 Ordinal logistic regression analysisa of factors associated with retinopathy levelsTable Footnoteb
Table 5 Nominal logistic regression analysisTable Footnotea of factors associated with nephropathyTable Footnoteb
Figure 1 Box plot of responses to question QE showing quartiles and outliers.
Notes: QE, lottery 1 low risk, low gain. Type 1, 5,823±2,138 (mean ± SE); type 2, 5,064±8,347; difference of the means, Mann–Whitney U-test, P=0.2805; and difference of variances, standard F-test, P<0.0001.
Abbreviation: SE, standard error.
Abbreviation: SE, standard error.
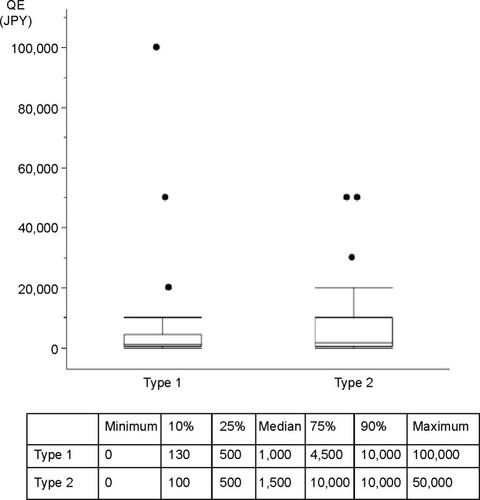
Table 6 Attitude to risk assessed by responses to a hypothetical lottery estimation (QE and QF)Table Footnotea