
Figures & data
Table 1 Characteristics of the total sample (N=104) and comparison between patients with low and high knowledge expectations
Table 2 Expected knowledge of patients undergoing CRT implantation (N=104)
Figure 1 Health complaints (measured with the Adjusted Postoperative Recovery Profile) in CRT patients presented as a proportion (%) of the group (N=104) who had mild, moderate, or severe problems with each complaint.
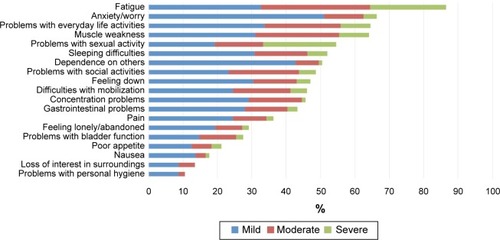
Table 3 Correlation coefficients (Spearman) among knowledge expectations of CRT patients (N=104) and their age, self-care, and health complaints
Table 4 The results of binary logistic regression analysis of the contribution of age and health complaints to high or low knowledge expectations (95% confidence intervals for odds ratio)