
Figures & data
Figure 1 Image shows artifact caused by stool stored in the rectum and interfered with the image quality. The examiner cannot easily measure the prostate sagittal length.
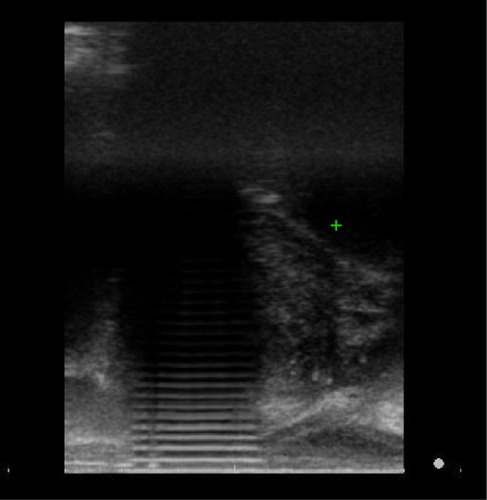
Figure 2 Distribution of pain score.
Abbreviation: VAS, visual analog scale.
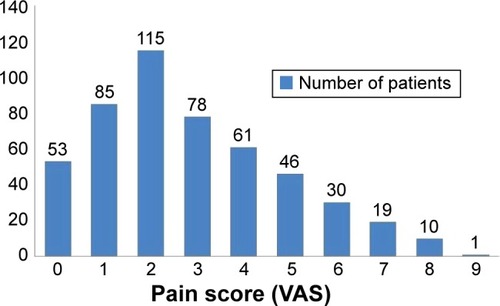
Figure 3 Kolmogorov–Smirnov test results showing that the pain score was normally distributed.
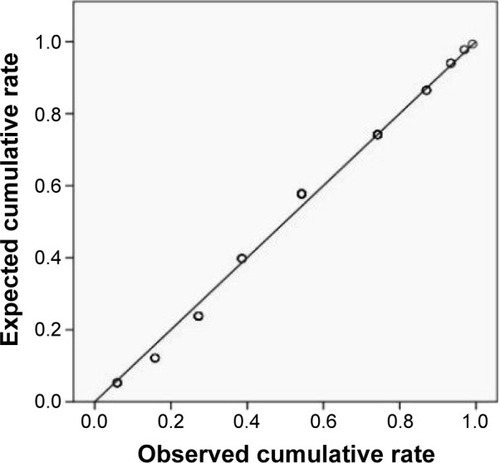
Table 1 Characteristics of the study population
Table 2 Comparison of patients’ numerical variables between pain score ≤3 and pain score ≥4
Table 3 Comparison of patients’ qualitative variables between pain score ≤3 and pain score ≥4
Figure 4 Significantly lower pain scores of group 2 patients compared with those of group 1 patients.
Abbreviation: VAS, visual analog scale.
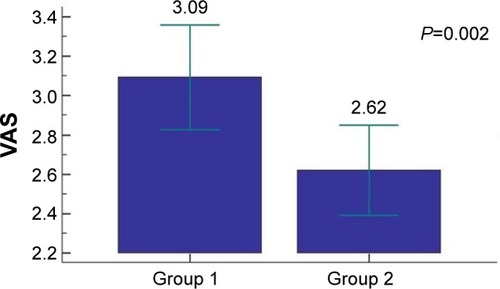
Table 4 Multivariate analysis for the pain associated with TRUS using linear regression analysis