
Figures & data
Figure 1 Distributions of adherence to nCPAP among newly diagnosed OSAS patients over time.
Abbreviations: nCPAP, nasal continuous positive airway pressure; OSAS, obstructive sleep apnea/hypopnea syndrome; CI, confidence interval.
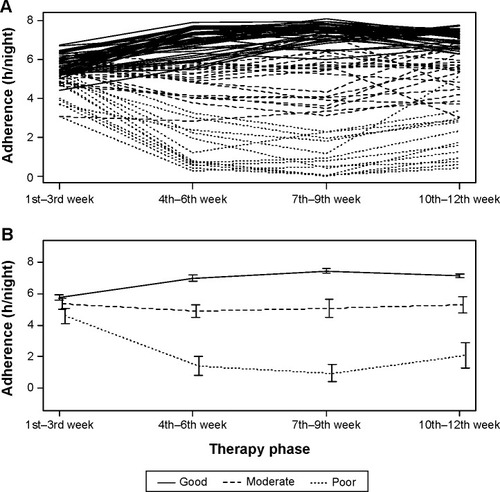
Table 1 Evaluation parameter of bss/tss from K-means cluster analysis and the number of subjects in the smallest cluster from K-means cluster analysis
Table 2 Baseline and 3rd week information and the average nightly adherence during the study according to the three patterns of adherence
Table 3 Cumulative logit regression results of baseline predictors of 12-week adherence pattern
Table 4 Cumulative logit regression results of first-3-week therapy predictors of 12-week adherence pattern
Figure 2 Distributions of baseline and first 3 weeks predictive score among three adherence patterns.
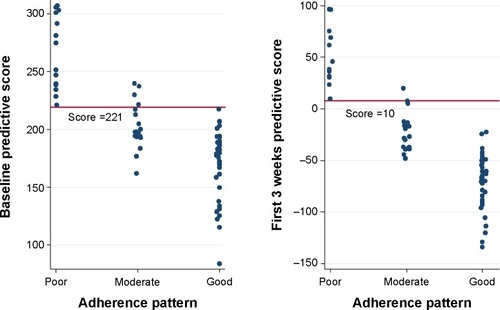
Figure 3 ROC curves of baseline and first-3-weeks predictive scores. Each symbol represents a different score.
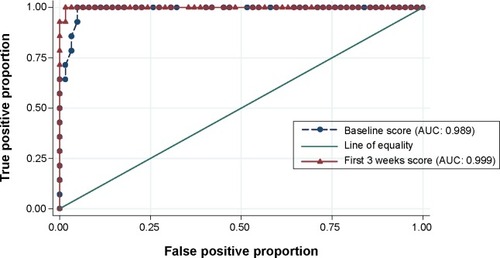
Table 5 Bootstrap evaluation of predictive ability of baseline and first-3-week predictive scores using the selected cut-off pointsTable Footnotea (mean and 95% bootstrap confidence interval)