
Figures & data
Figure 1 Prevalence of complications among patients with or without barriers to blood glucose control. (A) Prevalence of macrovascular complications. (B) Prevalence of microvascular complications.
Notes: OR, versus patient group without a barrier. The P-value was calculated with the Fisher’s exact test (two-sided). Macrovascular complication included any one of angina pectoris, myocardial infarction, arteriosclerosis obliterans, or cerebrovascular disease. Microvascular complication included any one of diabetic nephropathy, diabetic retinopathy, or diabetic neuropathy.
Abbreviation: OR, odds ratio.
Abbreviation: OR, odds ratio.
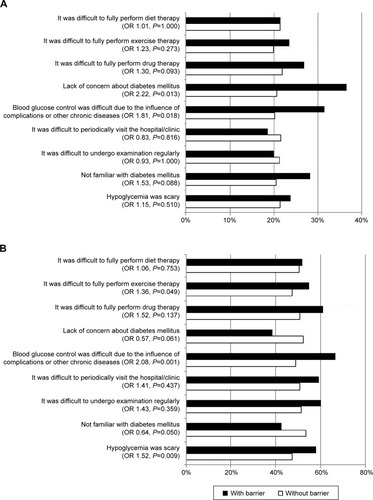
Table 1 Subject background factors
Figure 2 Barrier to blood glucose control (proportion of responders who said the barrier was present; a comparison between physicians and patients). (A) Total, (B) patients who visited hospitals, and (C) patients who visited clinics.
Note:
P-value was calculated with McNemar’s test with the continuity correction.
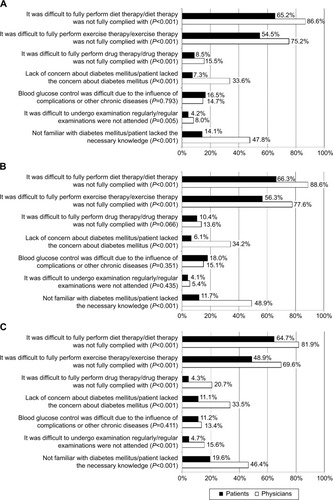
Table 2 Background factors according to the number of discrepancies in response among physicians and patients
Table 3 Background factors according to the presence or absence of barriers to blood glucose control