Figures & data
Figure 1 The mean (± SE) values for the patients’ FM/BW at the beginning of the study (basal) and after 4 weeks, 8 weeks, and 12 weeks.
Abbreviations: FM/BW, fat mass to body weight ratio; NS, not significant; SE, standard error.
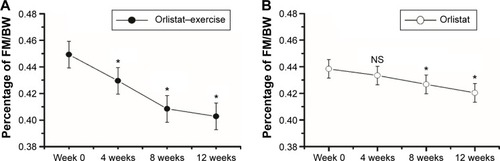
Figure 2 The mean (± SE) values for the patients’ FFM/BW at the beginning of the study (week 0) and after 4 weeks, 8 weeks, and 12 weeks for the orlistat–exercise group (black) and the orlistat group (white).
Abbreviations: FFM/BW, fat-free mass to body weight ratio; NS, not significant; SE, standard error.
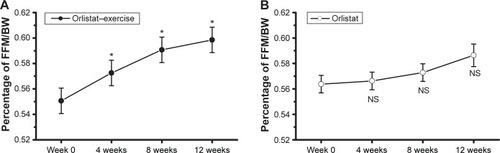
Table 1 The mean (± SE) values for BMI, body weight, fat mass, FFM, Wmax, work rate at the AT at the beginning of the study (basal), at 4 weeks, at 8 weeks, and at the end of the treatment period with orlistat and orlistat plus exercise
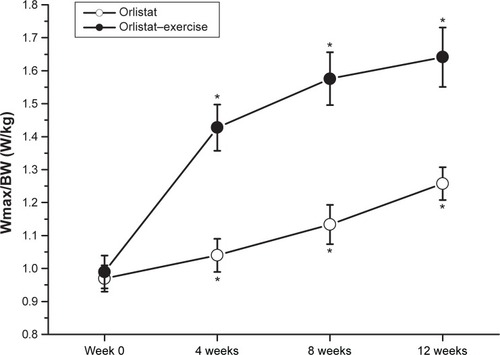
Figure 3 The mean (± SE) values for the patients’ Wmax/BW (W/kg) at the beginning of the study (basal) and after 4 weeks, 8 weeks, and 12 weeks for the orlistat group (white) and the orlistat–exercise group (black).
Abbreviations: Wmax/BW, maximal exercise capacity with regards to total body weight; SE, standard error; W, watts.