Figures & data
Figure 1 Study flow diagram of the identification process of RCTs for inclusion in this meta-analysis.
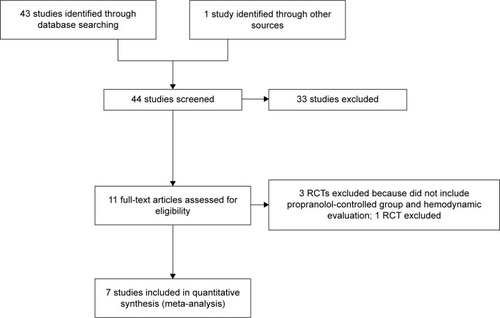
Table 1 Characteristics of seven included studies
Table 2 Characteristics of patients in seven included studies
Figure 2 Risk of bias summary. Green dot, low risk; red dot, high risk; empty cell, unclear risk.
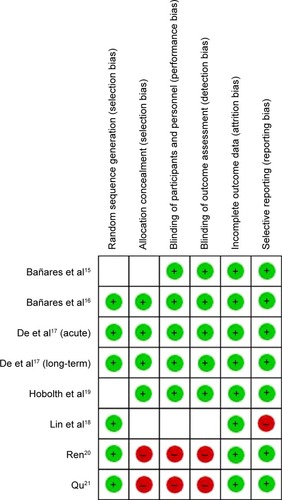
Table 3 Methodological quality assessment of included studies
Table 4 Main results of the included studies
Figure 3 Subgroup analysis (fixed-effect model) of the percentage of hepatic vein pressure gradient reduction, representing the MDs (rectangles) and 95% CI (horizontal lines) for trials that compared carvedilol and propranolol.
Abbreviations: MD, mean difference; CI, confidence interval; SD, standard deviation; IV, inverse variance; HVPG, hepatic vein pressure gradient.
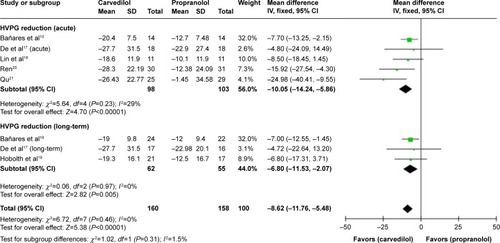
Figure 4 Subgroup analysis (fixed-effect model) of the percentage of hepatic vein pressure gradient reduction.
Abbreviations: MD, mean difference; CI, confidence interval; SD, standard deviation; IV, inverse variance; HVPG, hepatic vein pressure gradient.
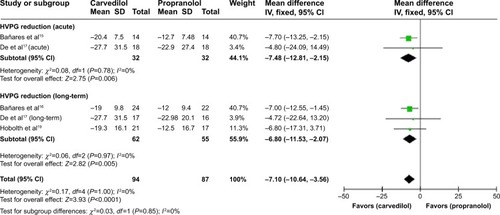
Figure 5 Subgroup analysis (fixed-effect model) of hemodynamic nonresponders, representing the RRs (rectangles) and 95% CI (horizontal lines) for trials that compared carvedilol and propranolol.
Abbreviations: RRs, risk ratios; CI, confidence interval; M–H, Mantel–Haenszel; HVPG, hepatic vein pressure gradient.
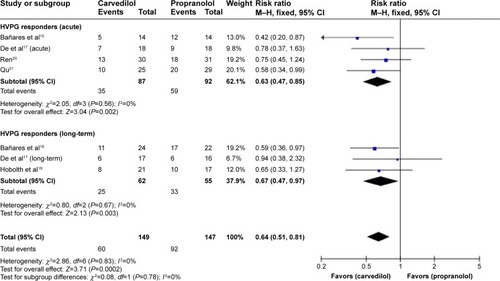
Figure 6 Subgroup analysis (fixed-effect model) of hemodynamic nonresponders.
Abbreviations: RRs, risk ratios; CI, confidence interval; M–H, Mantel–Haenszel; HVPG, hepatic vein pressure gradient.
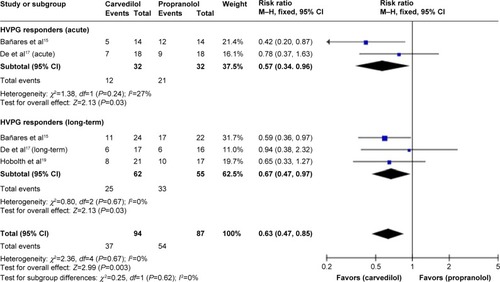
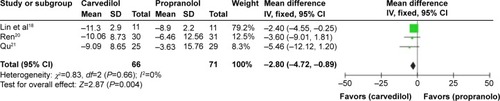
Figure 7 Subgroup analysis (random-effect model) of the percentage of mean arterial pressure reduction, representing the MDs (rectangles) and 95% CI (horizontal lines) for trials that compared carvedilol and propranolol.
Abbreviations: MD, mean difference; CI, confidence interval; SD, standard deviation; IV, inverse variance; MAP, mean arterial pressure reduction.
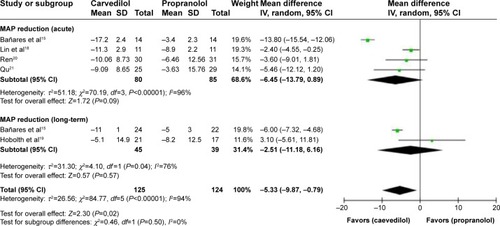
Table 5 %MAP reduction of the included studies
Figure 8 MD (fixed-effect model) of the percentage of mean arterial pressure reduction (%MAP reduction) between carvedilol and propranolol in acute treatment trials, excluding one study with unclear risk. The heterogeneity test is also performed.