Figures & data
Figure 1 Sample selection and attrition.
Notes: The overall response rate was 24.8% of all invited patients, with 21.3% eligible for inclusion with complete surveys. By cohort, 23.9% of biologic-experienced patients sent invitations provided complete responses, and 18.0% of biologic-naïve patients provided complete responses.
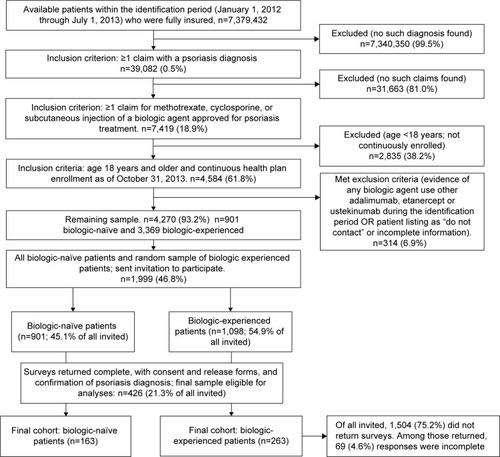
Table 1 Demographic and clinical characteristics of study population
Figure 2 Satisfaction with current psoriasis medication over the last 2–3 weeks or since last use.
Notes: Mean scores for each domain of questions regarding satisfaction. Scales are based upon the Treatment Satisfaction Questionnaire for Medication and have a range of 1–100. *P<0.001.
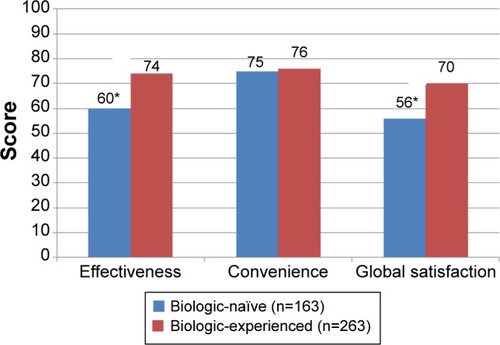
Figure 3 Choice of dosing frequency. Comparison within cohorts, percentages preferring once every 2–3 months vs once every 1–2 weeks (†P<0.001, ‡P=0.264). Comparison between cohorts, percentages preferring once every 2–3 months (*P=0.004).
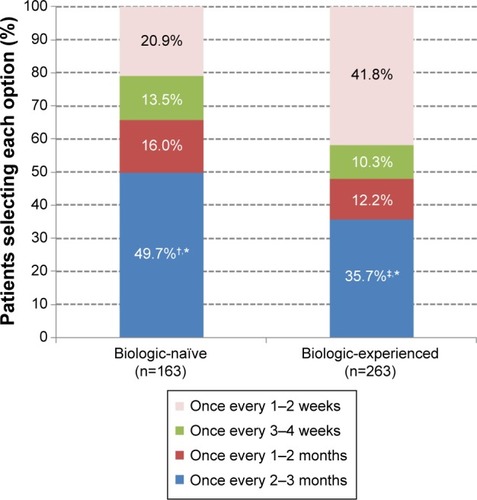
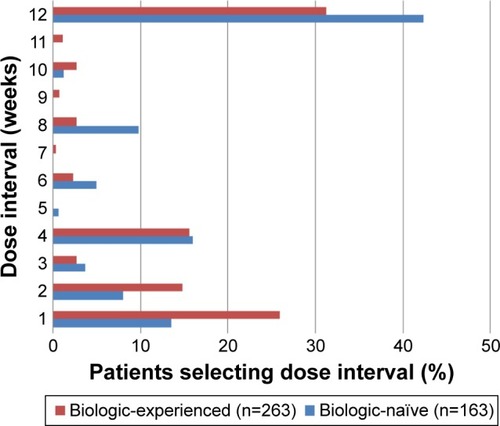
Figure 4 Specific dose interval selection.
Notes: Percentages of patients who chose each dose interval option when asked “If your physician provided you with several options for the frequency of an injection maintenance medication for your psoriasis, which of the following would you request?” Possible choices were whole week intervals (1 through 12) between doses.