Figures & data
Table 1 Dosing intervals and time below therapeutic threshold for patients 1–7
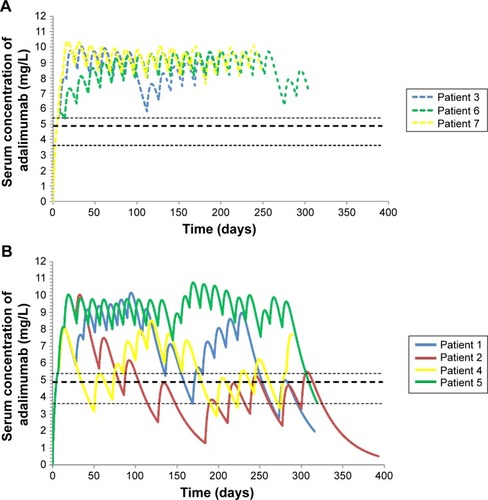
Figure 1 Serum concentration of adalimumab over time for patients whose serum levels (A) did not and (B) did drop below the therapeutic threshold.
Notes: Shown are serum levels of adalimumab for each of the seven patients. The timing of each dose for a patient, not specifically indicated in the figure, occurs immediately before each trough point. The bold dashed lines represent the primary therapeutic threshold (4.9 mg/L). The finer dashed lines are alternative cutoffs of 5.4 and 3.6 mg/L.