
Figures & data
Table 1 Clinical characteristics and pulmonary function tests in 83 patients with sarcoidosis classified according to radiological stage of the disease
Table 2 Cardiopulmonary exercise test results in 83 patients with sarcoidosis classified according to radiological stage of the disease
Figure 1 VO2 peak correlations with clinical, functional, and cardiopulmonary test parameters in 83 patients with sarcoidosis.
Abbreviations: FVC%, percent forced vital capacity; %pred, percent predicted; AT, anaerobic threshold; DLCO, diffusing capacity of the lung for carbon monoxide; VE, minute ventilation; VO2 peak, peak oxygen consumption; VT, tidal volume.
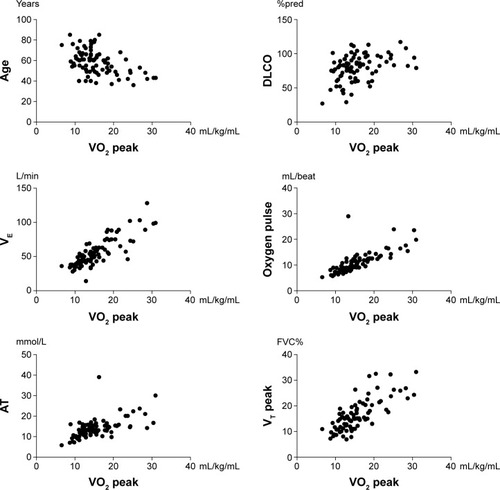
Table 3 Correlation of functional variables at rest with peak oxygen consumption (VO2 peak) in 83 patients with sarcoidosis according to radiological stages
Figure 2 Biplot of correlation coefficients (loading factors) of ergo/spirometric variables with PCA axes 1 and 2. The longer the arrow the greater effect is produced by the variable. Variables forming oblique angles correlate positively with each other and negatively at arrows with obtuse angles. The lower oblique or wider obtuse aperture the higher the correlation coefficient.
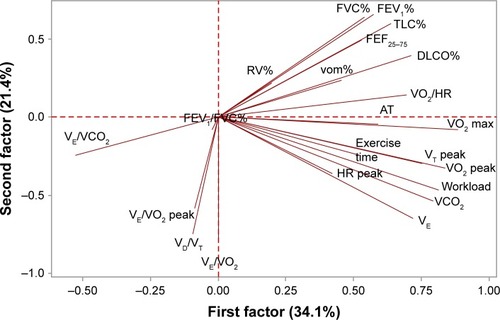
Figure 3 PCA scores and patients position as arranged by the two major axes according to radiological Stages I–III and the combined presence/absence of ecto-pneumonic location and restriction rules.
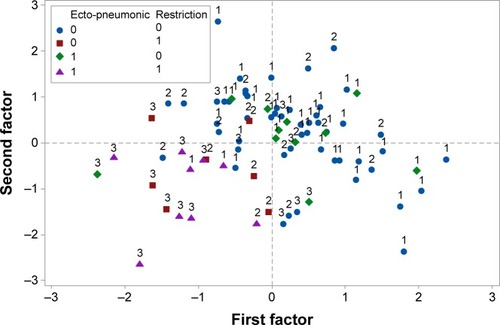
Figure 4 Mean changes of the significant ergo-/spirometric variables with the radiological conditions 1–3.
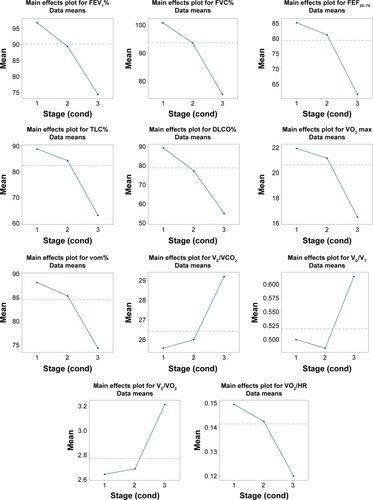
Figure 5 Mean changes of VO2 peak along with the ordinal categories of diffusing capacity of the lung for carbon monoxide (DLCO).
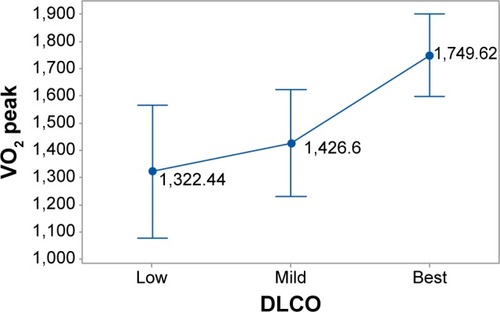
Table 4 Correlation of cardiopulmonary test variables with VO2 peak in 83 patients with sarcoidosis according to radiological stages