
Figures & data
Figure 1 Example of choice question convenience attributes.
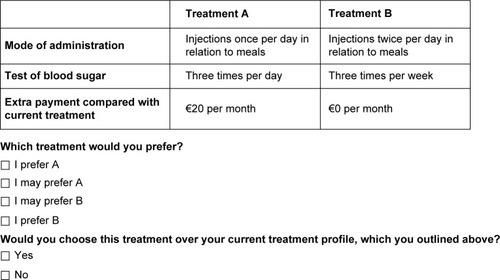
Figure 2 Example of choice question clinical attributes.
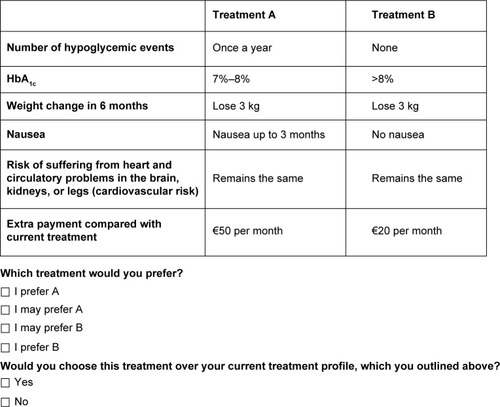
Table 1 Attributes and levels for the choice questions
Table 2 Patients’ and physicians’ sociodemographic and clinical characteristics
Table 3 Patients’ and physicians’ preferences for the treatment attributes
Table 4 Patients’ and physicians’ willingness to pay for diabetes treatment attributes
Table 5 Physicians’ and patients’ preferences for the convenience attributes
Table 6 Physicians’ and patients’ preferences for the clinical attributes
Figure 3 Comparison of physicians’ and patients’ monthly WTP for diabetes treatment attributes.
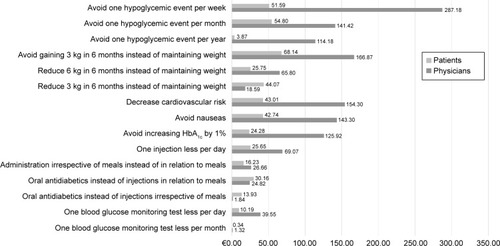
Table S1 Patients’ and physicians’ conditioning factors P-values results obtained by the multinomial model