
Figures & data
Table 1 Inclusion and exclusion criteria for the HeartCycle study
Table 2 Baseline characteristics of the study population
Figure 1 The number of patients per number of months of system usage.
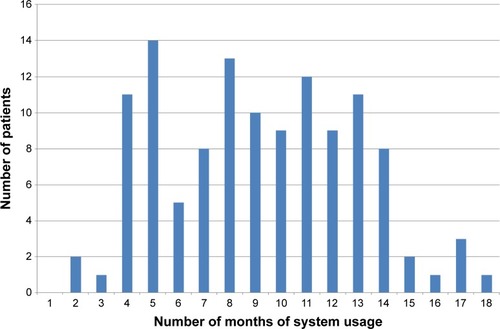
Figure 2 Percentage of adherent patients in the EHFScB-9 self-care behavior scale at baseline and study end (n=101).
Abbreviation: EHFScB-9, 9-item European Heart Failure Self-care Behavior Scale.
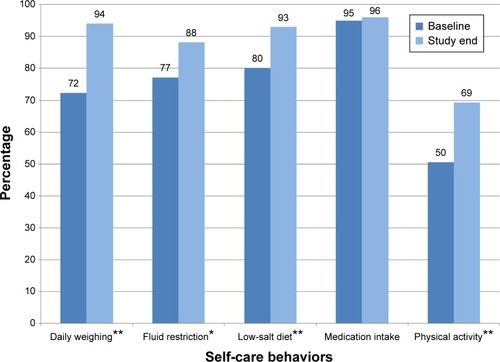
Table 3 Differences between the answers at baseline and study end for self-care behaviors measured with the EHFScB-9 scale (n=101)
Table 4 Objectively measured adherence per daily task (n=120)
Figure 3 Number of patient-months per adherence percentage interval (total number of patient-months =1,101).
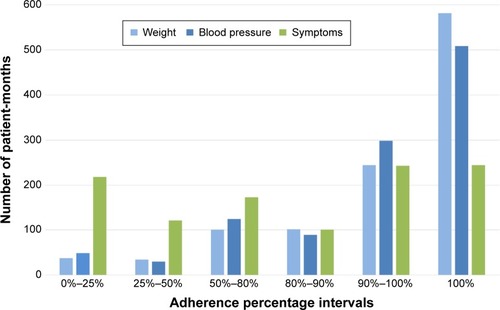
Figure 4 Average adherence over time for weight, blood pressure, and symptoms reporting. The numbers at the horizontal axis denote the number of patients who were using the system in that month. Since month M18 had only one patient, this month has been excluded from the figure.
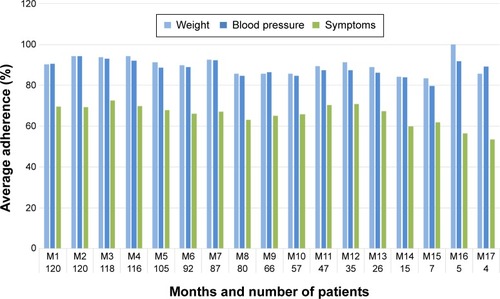
Figure 5 Box-and-whisker plot for measuring weight. Vertical axis shows adherence. Horizontal axis shows the months and the number of patients who were using the system in that month. Month M18 has been excluded from the figure since only one patient was using the system for 18 months.
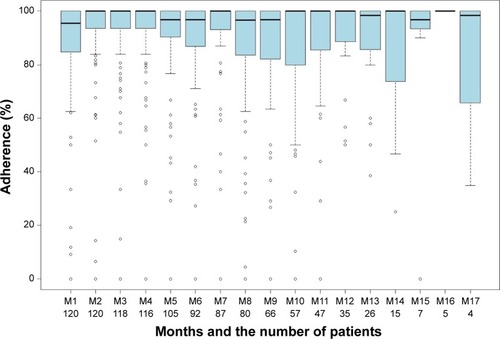
Figure 6 Box-and-whisker plot for measuring blood pressure. Vertical axis shows adherence. Horizontal axis shows the months and the number of patients who were using the system in that month. Month M18 has been excluded from the figure since only one patient was using the system for 18 months.
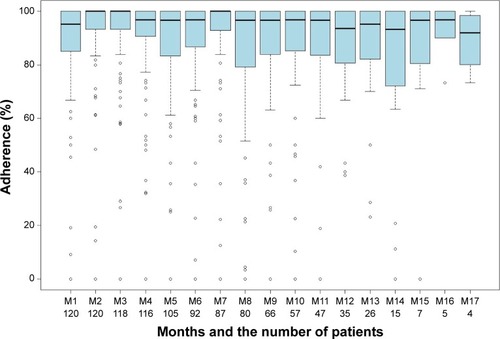
Figure 7 Box-and-whisker plot for symptoms reporting. Vertical axis shows adherence. Horizontal axis shows the months and the number of patients who were using the system in that month. Month M18 has been excluded from the figure since only one patient was using the system for 18 months.
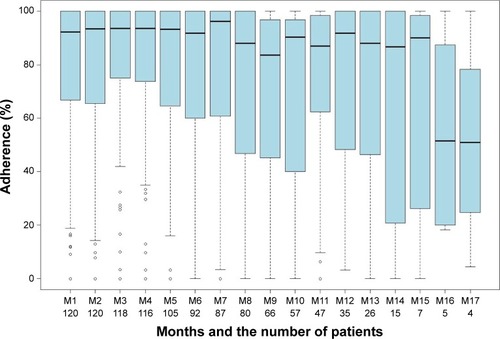
Table 5 Studies reporting on HF signs and symptoms monitoring adherence using telehealth system data
Table S1 The details corresponding to the box-and-whisker plots in –