
Figures & data
Figure 1 Flow chart illustrating the participation of patients who had an OAT installed at discharge from the stroke unit after stroke or transient ischemic attack.
Abbreviation: OAT, oral anticoagulant therapy.
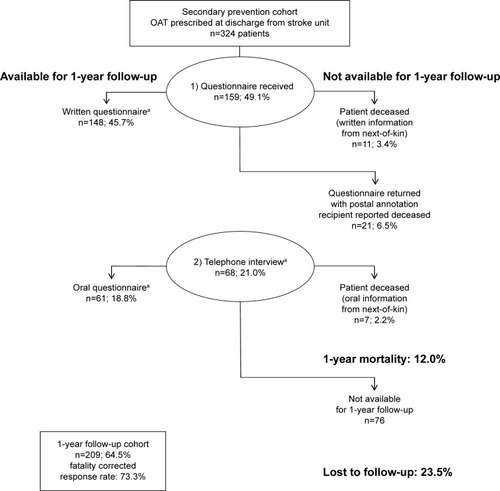
Figure 2 Global neurological function of the patients at 1-year follow-up.
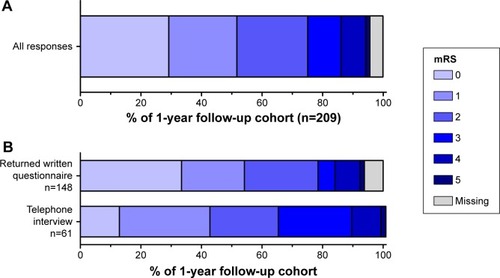
Table 1 Demographic characterization of patients’ anticoagulated with VKA or NOAC at discharge from our stroke units
Table 2 Persistence to OAT at 1 year by specific choice of OAT at discharge
Figure 3 Patients’ self-reported adherence assessed with the MMAS-8.
Abbreviations: MMAS-8, eight-point Morisky Medication Adherence Scale; VKA, vitamin K antagonists.
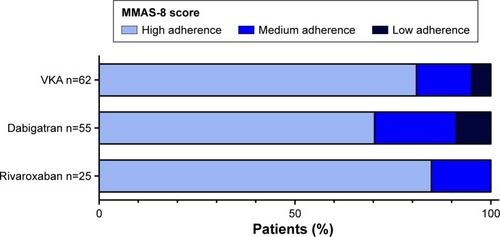
Figure 4 Multivariate analysis of factors influencing adherence to OAT in stroke patients.
Abbreviations: CI, confidence interval; DOAC, direct oral anticoagulants; mRS, modified Ranking Scale score; OAT, oral anticoagulant therapy; OR, odds ratio; VKA, vitamin K antagonists.
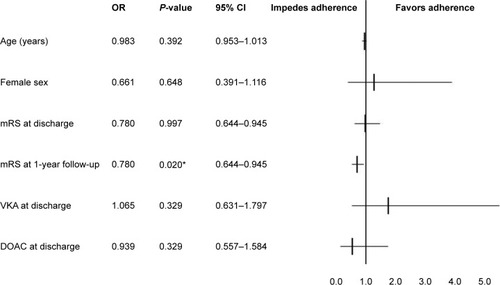
Table 3 Univariate comparison of patient characteristics between persistent and nonpersistent patients
Table S1 Demographic characterization by specific choice of OAT
Table S2 Reasons to switch therapy during the 1-year follow-up period