
Figures & data
Figure 1 Procedure for sample selection.
Abbreviation: CPEC, cataract and primary eye care.
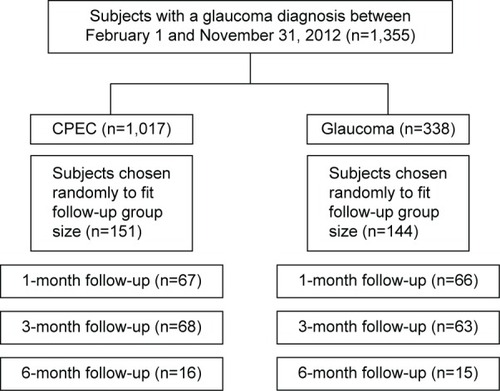
Figure 2 Scheduling procedure for the (A) CPEC clinic and the (B) glaucoma clinic, the control group.
Abbreviation: CPEC, cataract and primary eye care.
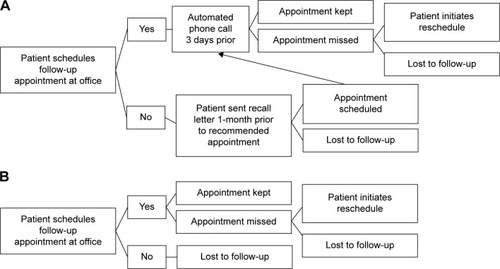
Table 1 Baseline characteristics of patients in the CPEC (N=151) and glaucoma clinics (N=144)
Table 2 Characteristics of nonadherent and adherent patients
Table 3 Odds ratios for multiple logistic regression analysis of risk factors for adherence with glaucoma follow-up visit