Figures & data
Figure 1 Monthly study log.
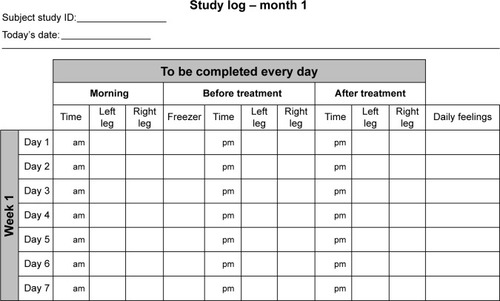
Table 1 Demographics
Figure 2 CONSORT flow diagram.
Abbreviation: CONSORT, consolidated standards of reporting trials.
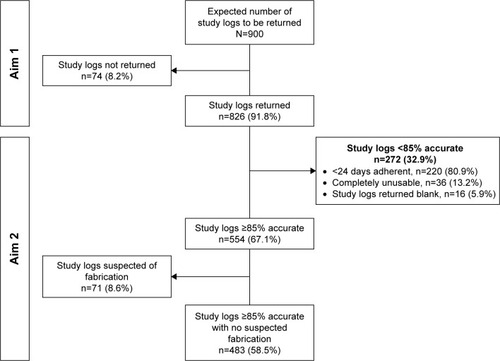
Table 2 Returned participant study logs error typology
Table 3 Average accuracy of participant monthly study logs by demographics
Table 4 Average accuracy of participant monthly study logs by end-of-study satisfaction survey
Figure 3 Mean monthly leg skin temperature difference before and after cooling treatment within the control group (placebo cuff) under ITT and mITT analysis.
Note: No statistical difference found between mITT and ITT analyses (P-value 1.0).
Abbreviations: ITT, intention-to-treat; mITT, modified intention-to-treat.
Abbreviations: ITT, intention-to-treat; mITT, modified intention-to-treat.
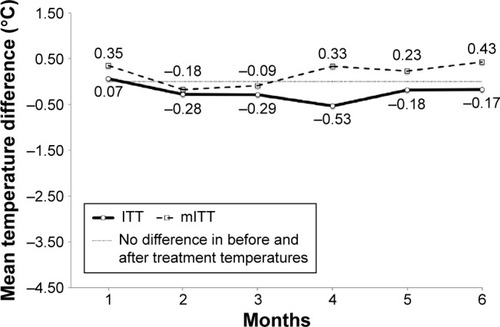
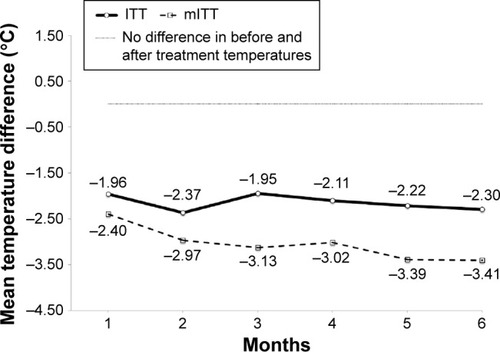
Figure 4 Mean monthly leg skin temperature difference before and after cooling treatment within the intervention group (cooling gel-cuff) under ITT and mITT analysis.
Note: No statistical difference found between mITT and ITT analyses (P-value 1.0).
Abbreviations: ITT, intention-to-treat; mITT, modified intention-to-treat.
Abbreviations: ITT, intention-to-treat; mITT, modified intention-to-treat.