Figures & data
Table 1 Treatment characteristics (attributes) and ranges (levels) used to create hypothetical treatment profiles
Figure 1 An example of treatment-choice scenario given to respondents.
Note: Currency is in USD.
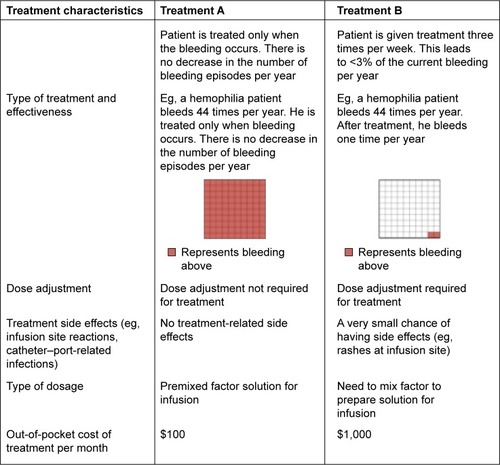
Table 2 Survey respondent demographics
Table 3 Patient preferences for hemophilia therapies – mixed logit model analysis
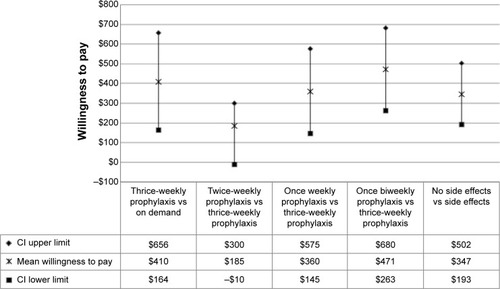
Figure 2 Willingness to pay (WTP) for significant treatment characteristics.
Notes: The figure indicates the upper and lower confidence limits (CI) and mean WTP. For example, the mean incremental WTP for thrice-weekly prophylaxis versus on-demand therapy is $410 out of pocket per month. The CI for this mean WTP is $164–$656. Currency is in USD.
Abbreviation: CI, confidence interval.
Abbreviation: CI, confidence interval.