
Figures & data
Figure 1 Decision-tree model.
Abbreviations: adh, adherence; erad, eradication; FN, false negative; FP, false positive; p, probability; prev, prevalence; QALYs, quality-adjusted life-years; TN, true negative; TP, true positive; Tx, treatment.
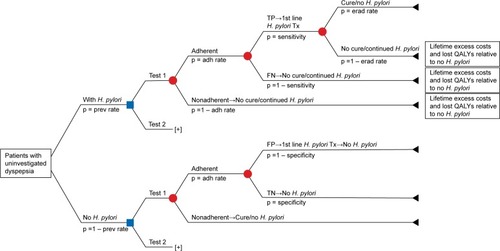
Table 1 Population characteristics, treatment attributes, and data for diseases related to Helicobacter pylori infection
Table 2 Test characteristics
Table 3 Base-case economic and health outcomes
Figure 2 Effect of adherence and prevalence.
Abbreviations: FAT, fecal antigen test; ICER, incremental cost-effectiveness ratio; QALY, quality-adjusted life-year; UBT, urea breath test.
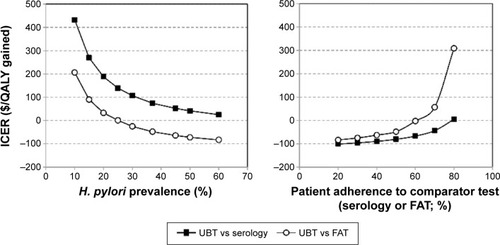
Figure 3 Cost-effectiveness scatterplots for comparisons of urea breath test with (A) monoclonal fecal antigen test and (B) serology.
Abbreviations: PSA, probabilistic sensitivity analysis; QALYs, quality-adjusted life-years.
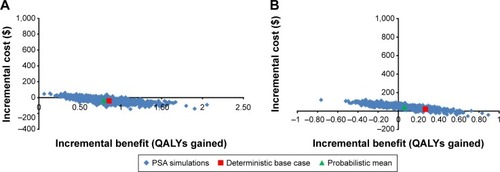
Table S1 Estimation of excess lifetime costs associated with peptic ulcer disease