
Figures & data
Figure 1 Conceptual framework of DIAB-Q.
Abbreviation: DIAB-Q, Diabetes Intention, Attitude, and Behavior Questionnaire.
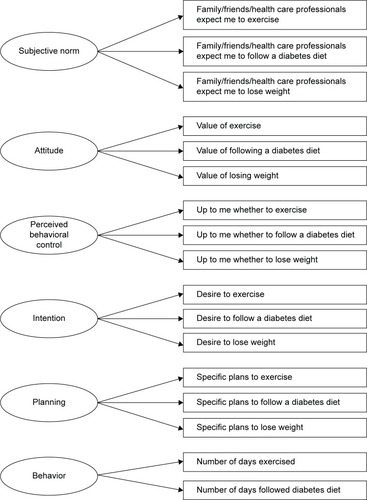
Table 1 Demographic characteristics of the Stage II population
Table 2 Construct validity – correlations between the DIAB-Q and the collateral measures
Table 3 Mean scale scores for DIAB-Q constructs by BMI category, HbA1c category, and disease severity