Figures & data
Table 1 Demographic characteristics of the study population and awareness of their diagnosis
Table 2 Comorbidities in the population of rheumatology patients studied
Figure 1 Diagnoses and awareness of adverse drug reactions in the population of rheumatology patients studied.
Notes: Group 1, patients aware of adverse drug reactions in their medical history; group 2, patients not aware of adverse drug reactions in their medical history. Stacked percentage bars represent the distribution of patients from groups 1 and 2 according to their diagnosis.
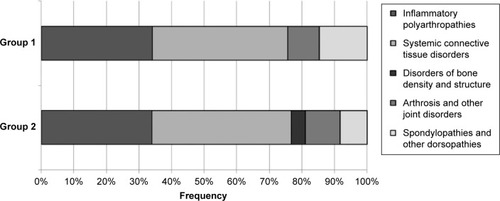
Figure 2 Frequency histogram of adverse drug reactions reported in rheumatology patients with different diagnosis (vertical bars).
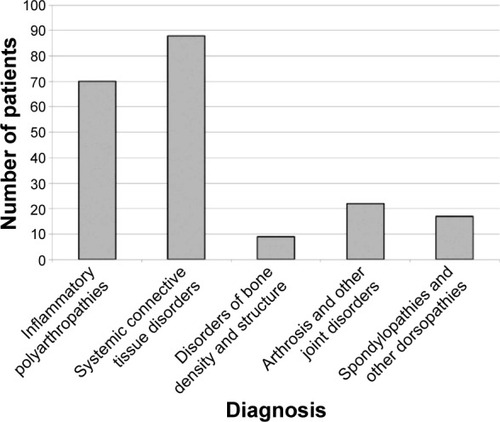
Figure 3 Distribution of adverse drug reactions reported according to the MedDRA system organ classes (frequency histogram).
Abbreviations: ADRs, adverse drug reactions; MedDRA, Medical Dictionary for Regulatory Activities.
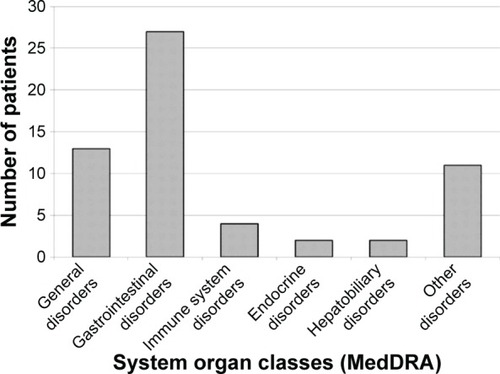
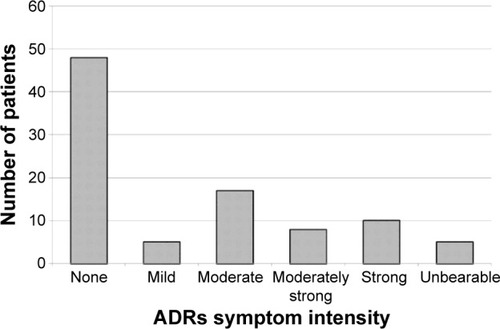
Figure 4 Distribution of adverse drug reactions (ADRs) reported according to the symptom intensity assessed by 5-point visual analog scale (frequency histogram).