
Figures & data
Table 1 Sample characteristics
Table 2 Self-stigma, adherence, and discontinuation of medication in the entire sample in relation to sex, education, and partnership status
Figure 1 Linear regression between total ISMI scores and adherence.
Abbreviation: ISMI, Internalized Stigma of Mental Illness.
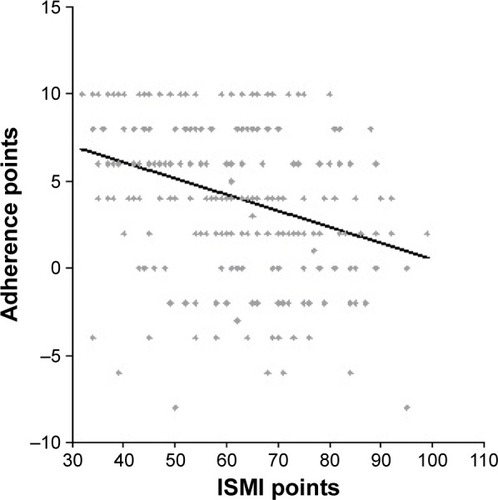
Table 3 ISMI scores for individual diagnostic categories
Table 4 Levels of adherence in individual diagnostic categories
Figure 2 Frequency of discontinuation of medication in individual diagnostic categories (percentages).
