
Figures & data
Figure 1 Overview of study procedure.
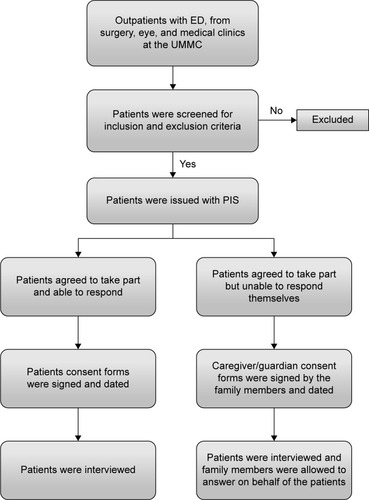
Table 1 Definition
Figure 2 Flowchart of patient disposition.
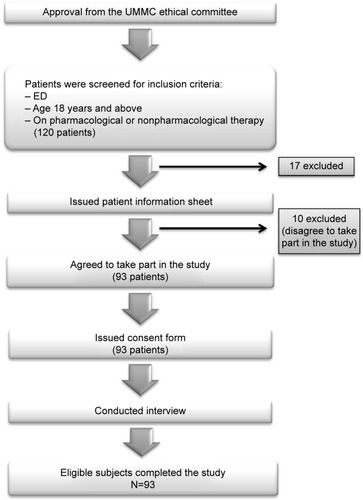
Table 2 Patients’ demographic characteristics
Table 3 The association between duration of ED and demographic characteristics
Figure 3 Overall psychological score rated by patients.
Abbreviation: ED, erectile dysfunction.
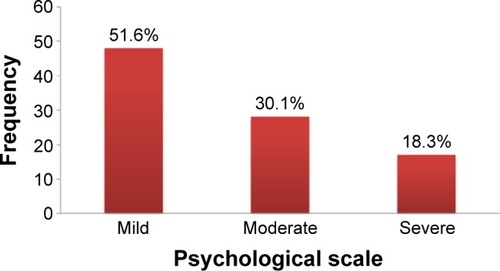
Table 4 Overall psychological scales
Table 5 Psychological factors associated with ED patients
Table 6 The association between psychological scale and demographic characteristics
Figure 4 Causes of ED as perceived by patients.
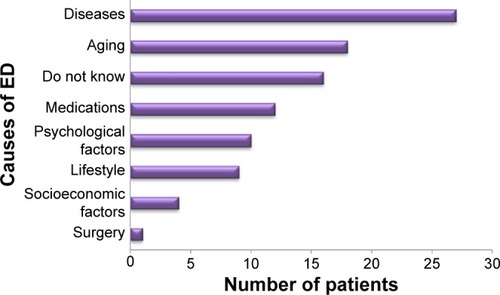
Table 7 Patients’ knowledge about ED and its occurrence
Figure 5 Type of medication taken by the study population.
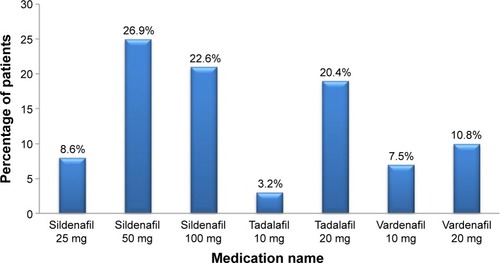
Table 8 Knowledge of patient on ED treatment
Table 9 The overall results of patient’s knowledge of ED therapy
Table 10 The association between educational level and patient’s knowledge about ED
Table 11 The association between occupation and patient’s knowledge about ED
Table 12 The association between household income and patient’s knowledge about ED