
Figures & data
Table 1 Values for hard tissue analysis
Table 2 Values for soft tissue analysis
Table 3 Description of the evaluators
Figure 1 Models of silhouette (F11), black and white photograph (F12), and chromophotograph (F13) of the same boy.
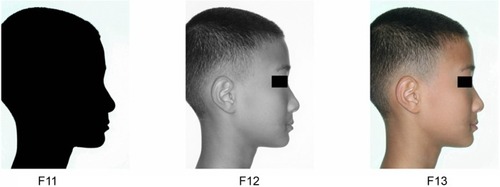
Figure 2 Models of silhouette (F21), black and white photograph (F22), and chromophotograph (F23) of the same girl.
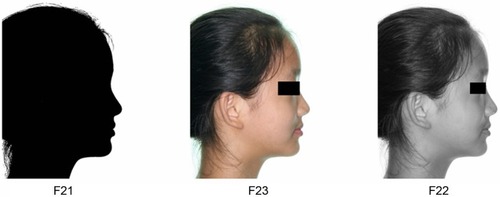
Table 4 Evaluation scores according to the profiles of the boy and girl
Figure 3 Models of chromophotograph of the boy with different lip positions (F31–F37).
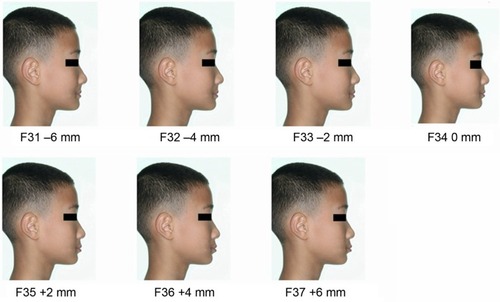
Figure 4 Models of chromophotograph of the girl with different lip positions (F41–F47).
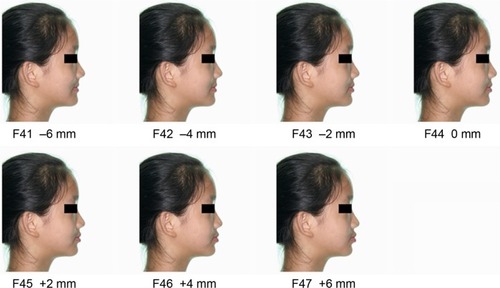
Figure 5 Evaluation scores according to the distance to E line (mm).
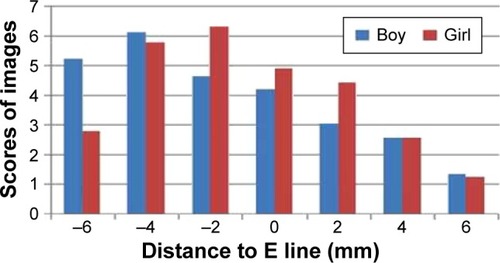
Table 5 Values of the distance to the line E (mm) of the most attractive images, F32 and F45