
Figures & data
Table 1 Participant demographics and baseline information in the Healthy Weights Initiative, N=296
Table 2 Baseline BDI-II scores across demographics and program completion and adherence (lower scores indicate better mood), N=290
Figure 1 Flow diagram for included participants.
Abbreviation: BDI-II, Beck Depression Inventory II.
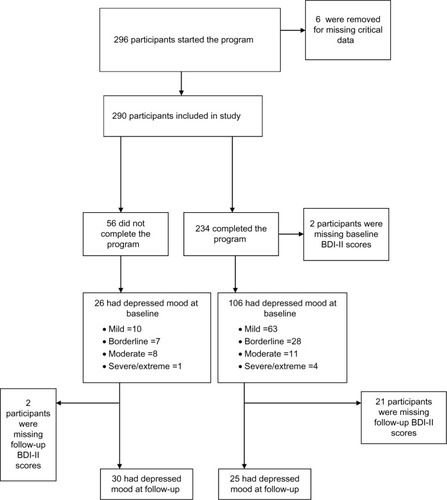
Table 3 Comparing baseline and follow-up BDI-II scores between those who completed the program and those who quit (lower scores indicate better mood), N=290
Table 4 Subgroup with BDI-II scores of ≥11 at baseline (n=106)
Table 5 Subgroup with BDI-II scores of ≥11 at baseline (n=106)
Table 6 Independent risk factors for having depressed mood at follow-up