Figures & data
Table 1 Sociodemographics, medical information, and relevant pharmacological treatment in each patient
Table 2 QoL and dysexecutive failures as rated by patients and health carers, and heart rate variability results
Table 3 Parametric/nonparametric correlation coefficients and robustness for relationships among vmHRV, QoL, and everyday cognitive failures
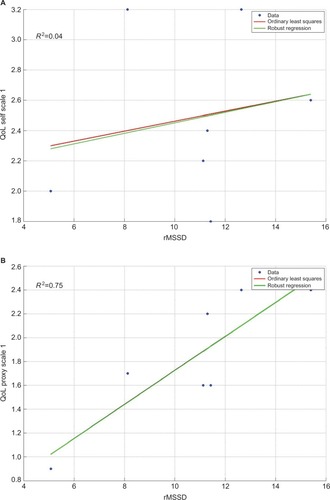
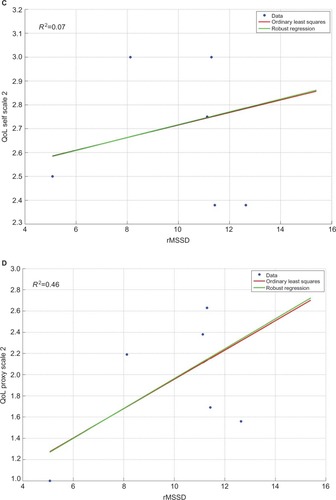
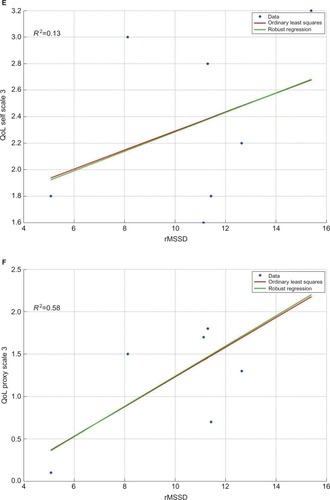
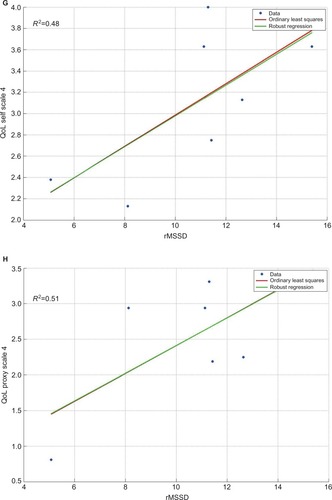
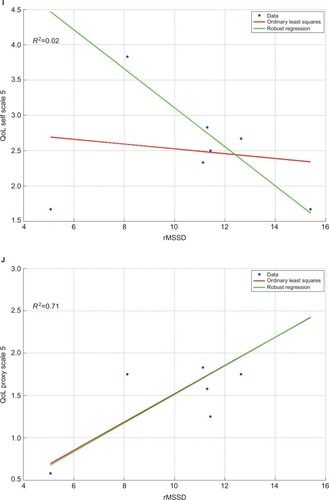
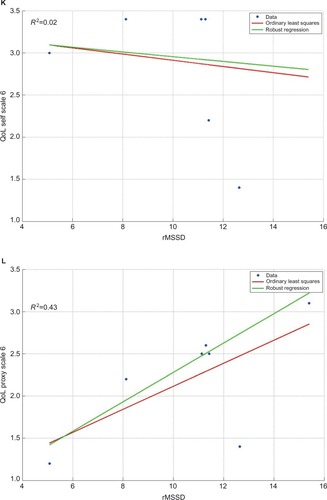
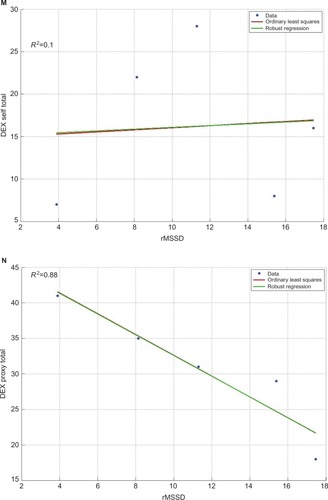
Figure 1 Comparison of ordinary least square regressions and robust regressions for self- and proxy ratings on the six QoL-profile scales (A–L) and the occurrence of everyday executive dysfunctions (M and N).
Notes: QoL-profile for chronically ill patients.Citation31 For scale names, please refer to the text. Higher scores indicate a more positive QoL rating. DEX taken from the BADS.Citation32 Higher DEX scores indicate higher ratings on the occurrence of everyday cognitive dysfunctions. The red line represents the ordinary least squares regression line. The green line represents the robust regression computed by the robustfit algorithm implemented in MATLAB® software (The MathWorks, Inc., Natick, MA, USA).
Abbreviations: BADS, Behavioral Assessment of the Dysexecutive Syndrome; DEX, Dysexecutive Questionnaire; rMSSD, root mean square successive difference; QoL-profile, quality of life profile.
Abbreviations: BADS, Behavioral Assessment of the Dysexecutive Syndrome; DEX, Dysexecutive Questionnaire; rMSSD, root mean square successive difference; QoL-profile, quality of life profile.