
Figures & data
Table 1 Sociodemographic characteristics of the participants (N=149)
Table 2 Distribution of answers in Internet addiction test (N=149)
Figure 1 Correlation between total scores of Internet addiction test and age (in years).
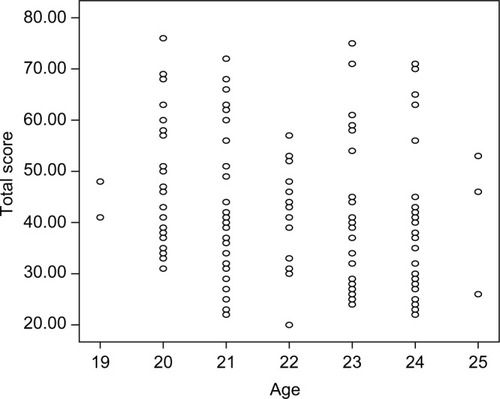
Figure 2 Correlation between total scores of Internet addiction test and duration of daily Internet usage (in hours).
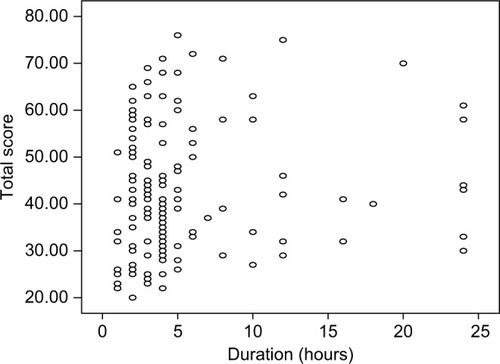
Figure 3 Association between examination grade (1=A, 2=B, 3=C, 4=pass) and duration of Internet usage in hours (N=147).
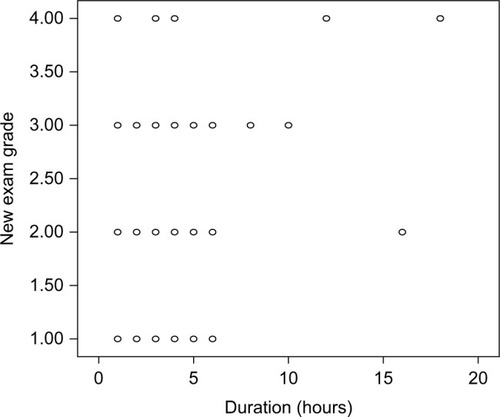
Table 3 Comparison of total scores of Internet addiction test between sociodemographic characteristics using independent t-test (N=149)
Table 4 Post hoc analysis of comparison of total scores of Internet addiction test between the years of study using Mann–Whitney U test (N=149)
Table 5 Correlation between total scores of Internet addiction test and exam grade, age (in years), and duration of daily Internet usage (in hours) using Pearson’s correlation test (N=149)
Table 6 Correlation between examination grade and duration of Internet usage (N=147) found using Spearman’s correlation test
Figure 4 Email addresses used by participants (N=146).
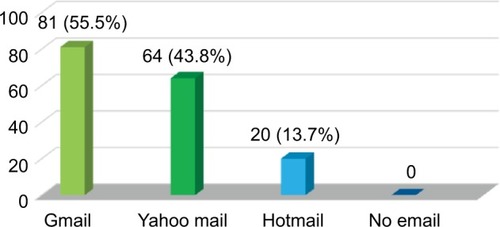
Figure 5 Number of email addresses owned by participants (N=146).
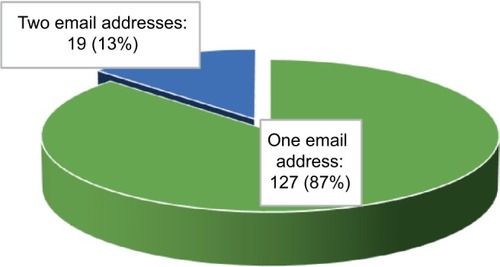
Figure 6 Major purpose of using Internet (N=146).
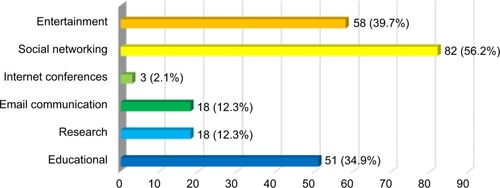
Figure 7 Distribution of severity scale of Internet addiction (N=139).
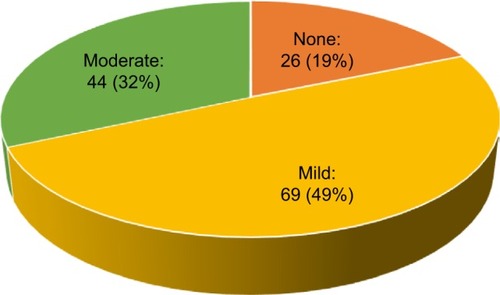
Table 7 Comparison of total scores of Internet addiction test between social media characteristics using nonparametric test (N=149)