Figures & data
Table 1 Mean comparison of willingness to continue investments based on sunk cost levels
Table 2 Descriptive statistics
Table 3 Pearson correlation
Table 4 Results of path analysis
Figure 1 The sunk cost effect in high/low cognitive dissonance.
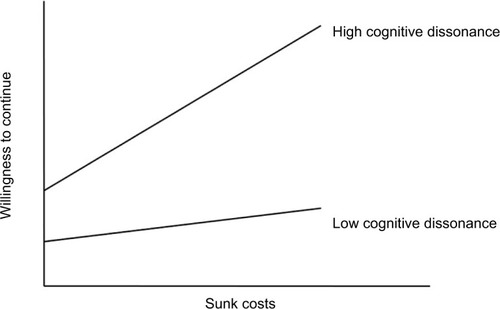
Table 5 Results of regression analyses
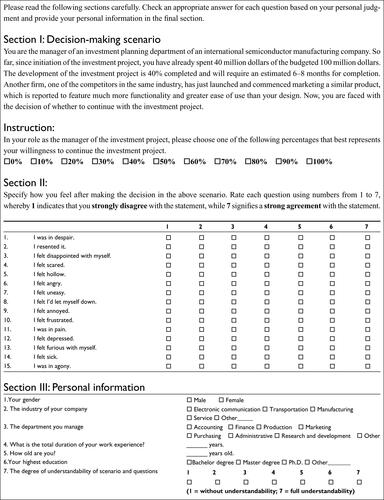
Figure S1 An example of the experimental scenarios