
Figures & data
Figure 1 Visualization of the DNMT3A rs11683424 polymorphism using agarose gel electrophoresis.
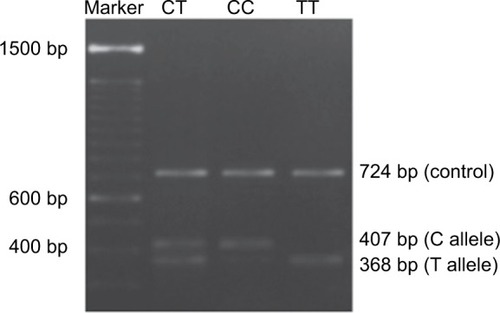
Figure 2 Frequency and variants of the DNMT3A gene (CC, CT, and TT) in healthy subjects.
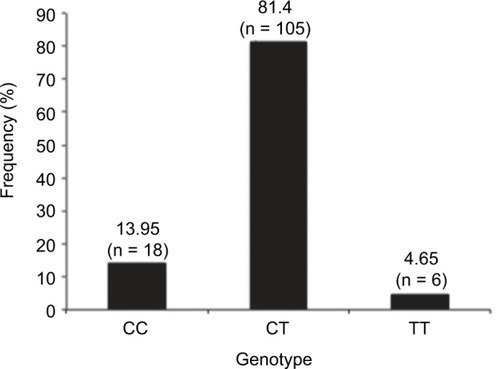
Table 1 Hardy–Weinberg equilibrium for the observed and expected genotype frequencies for DNMT3A rs11683424
Table 2 The Kessler Psychological Distress Scale (K10) of healthy subjects: distribution correlated with the variations of genotype
Figure 3 The Kessler Psychological Distress Scale (K10) of healthy subjects: distribution correlated with the variation of genotype (bar graphs).
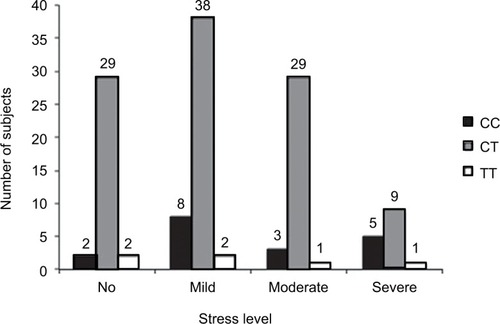
Table 3 The rs11683424 variant of DNMT3A and gender