
Figures & data
Table 1 Family characteristics between the ADHD (n=132) and the control (n=138) groups
Table 2 Multivariate logistic regression analyses of family environmental factors associated with ADHD risk
Figure 1 FES-CV scores of the ADHD and the control groups (mean ± SD).
Abbreviations: ADHD, attention-deficit/hyperactivity disorder; FES-CV, Family Environment Scale Chinese Versions.
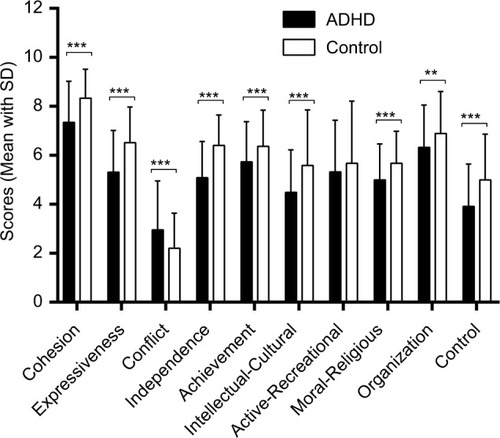
Figure 2 Conners’ Children Behavior Scale scores between the ADHD and the control groups (mean ± SD).
Abbreviations: ADHD, attention-deficit/hyperactivity disorder; CIH, Conners’ Index of Hyperactivity; CPRS, Conners’ Parent Rating Scale; CTRS, Conners’ Teacher Rating Scale.
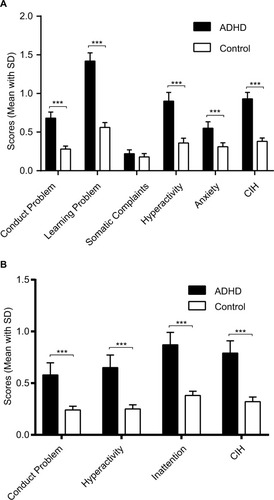
Figure 3 WFIRS-P scores of the ADHD and the control groups (mean ± SD).
Abbreviations: ADHD, attention-deficit/hyperactivity disorder; WFIRS-P, Weiss Functional Impairment Scale-Parent.
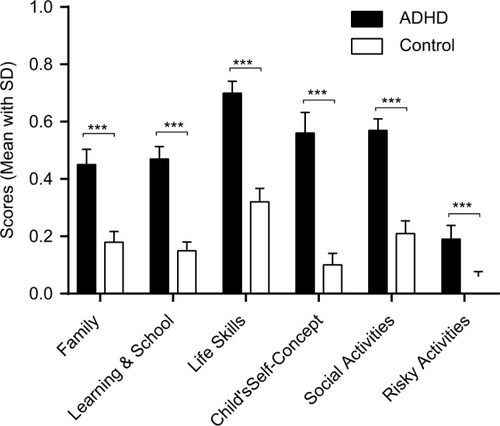
Table 3 Observed behaviors between the ADHD (n=132) and the control (n=138) groups
Figure S1 Flowchart of the two-stage procedures of sampling participants and diagnosis of ADHD.
Abbreviation: ADHD, attention-deficit/hyperactivity disorder.
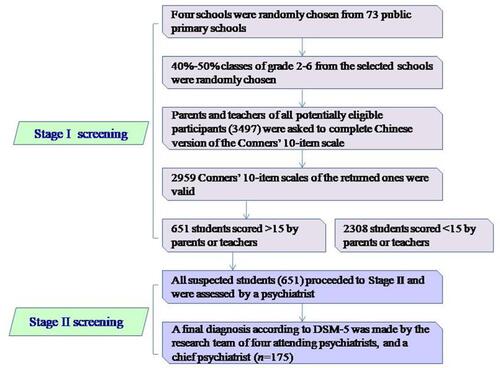
Table S1 Correlation analyses between selected dimensions’ score between CPRS and CTRS (n=270)