Figures & data
Table 1 Control group and ultra-marathon finishers group distributions depending on age
Table 2 Non-starters and ultra-marathon finishers frequencies in specific characteristics related to training experience and starting performance
Table 3 Basic descriptive statistics of MOMS scales in control group and ultra-marathon finishers group
Figure 1 Comparison of motivations between ultra-marathon runners and control group.
Notes: *P<0.05,
†P<0.01,
‡P<0.001. Error bars indicate the mean SD.
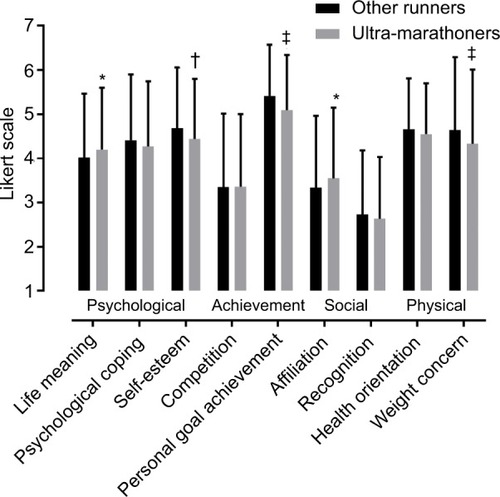
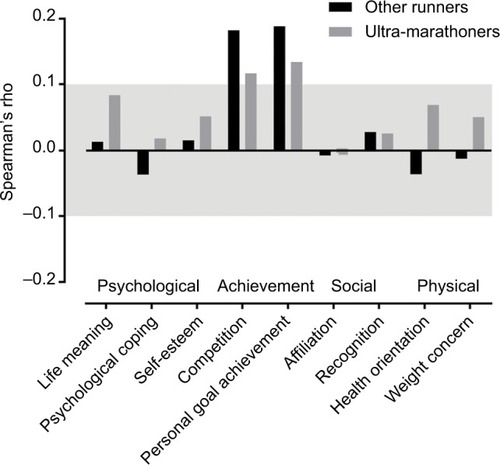
Figure 2 Relationship between motivations and number of finished marathon races.
Note: The shadows denote correlation of trivial magnitude.
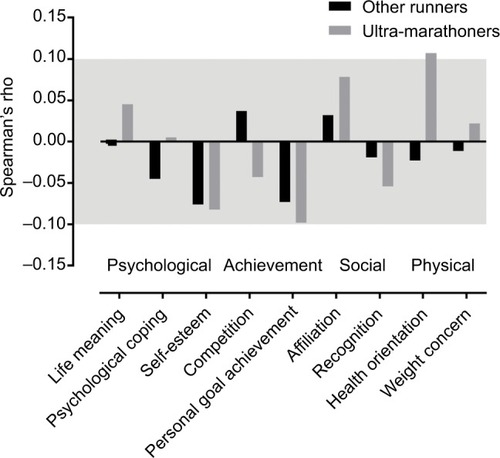
Figure 3 Relationship between motivations and years of training experience.
Note: The shadows denote correlation of trivial magnitude.
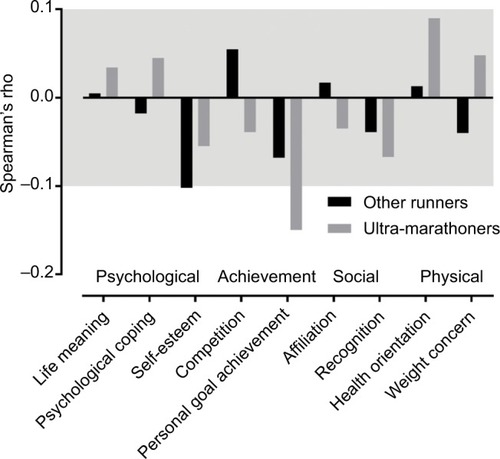
Figure 4 Relationship between motivations and number of weekly training days.
Note: The shadows denote correlation of trivial magnitude.