
Figures & data
Table 1 Information of the 60 musical excerpts: their original sources, start–stop bars, durations (seconds), playing instruments, composers, putative emotions, and acoustic featuresTable Footnotea
Figure 1 Flowchart of the experimental design.
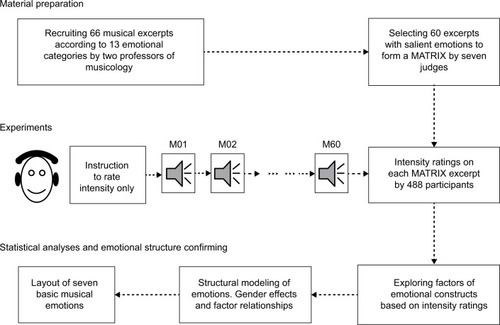
Figure 2 Scree plot from the exploratory factor analysis of the intensity ratings on 60 musical excerpts in 488 participants.
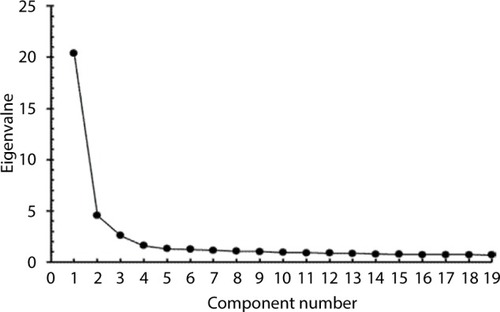
Table 2 Model fit parameters based on the first-order analyses in 488 participants
Table 3 The internal consistencies of seven music domains (second-order level) in all participants (n=488) and the intensity ratings (mean ± SD) of each domain in female (n=274) and male (n=214) participants
Table 4 Inter-relationships between seven musical emotions in 488 participants