Figures & data
Figure 1 Selection process for study inclusion in the systematic review and meta-analysis.
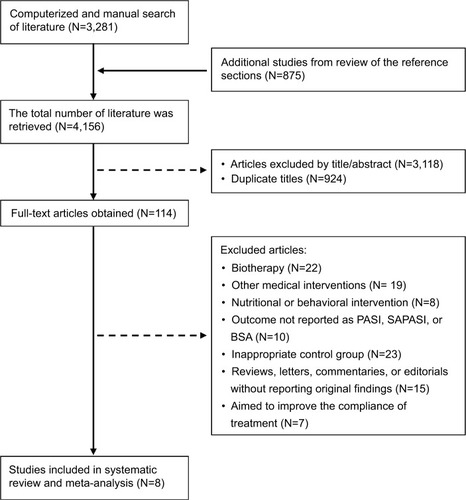
Table 1 Characteristics of included studies
Figure 2 Pooled estimates of the efficacy of the psychological intervention by outcome measures.
Abbreviations: PASI, Psoriasis Area and Severity Index; SAPASI, Self-administered Psoriasis Area and Severity Index.
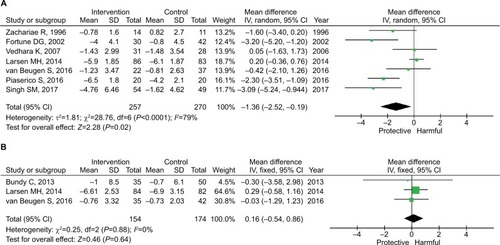
Figure 3 Subgroup analysis by the method of intervention.
Abbreviation: CBT, cognitive behavioral therapy.
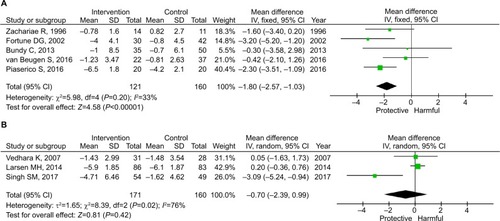
Figure 4 Subgroup analysis by the use of systemic treatment among those receiving CBT.
Abbreviation: CBT, cognitive behavioral therapy.
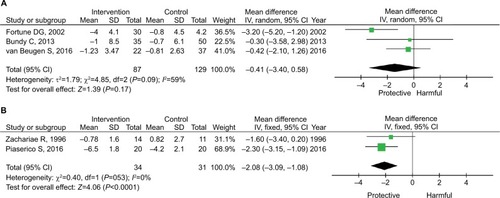
Figure 5 Subgroup analysis by the severity of psoriasis before intervention.
Abbreviation: PASI, Psoriasis Area and Severity Index.
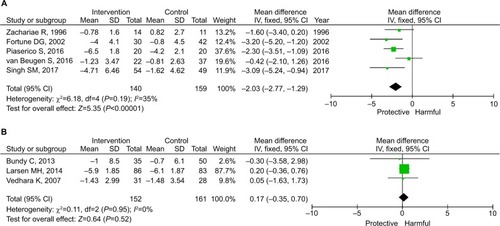
Figure 6 Subgroup analysis by the location of intervention.
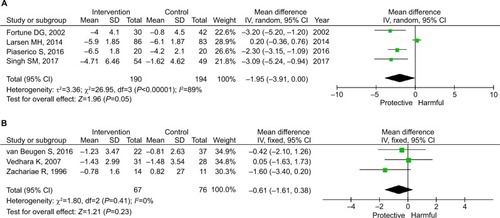
Table 2 Methodological quality of included studies
Figure S1 Pooled estimates and 95% CIs in sensitivity analysis.
Note: Each bar signifies the pooled estimate when deleting the corresponding study.
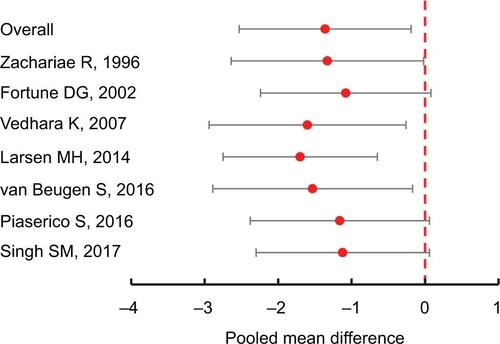
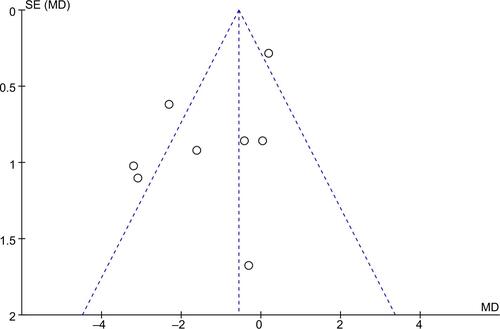
Figure S2 Funnel plot to assess the publication bias.