
Figures & data
Figure 1 The experimenter (right) introducing the participant (left) to two female students (prerecorded confederates) at the beginning of the experimental interaction.
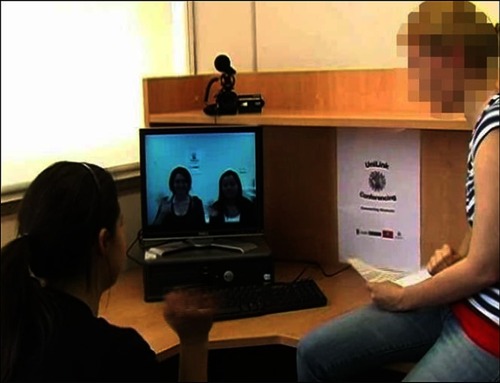
Table 1 Age and gender distribution of included vs ostracized participants
Table 2 Experiment 1 included vs ostracized participants on negative attitudes and emotion expressions during the interaction
Table 3 Experiment 2 included vs ostracized participants on self-reported emotion and emotion expressions during the interaction
Figure 2 A comparison of the proportion of Duchenne vs non-Duchenne smile expressions during the experimental interaction for included vs ostracized participants for both Experiment 1 and Experiment 2.
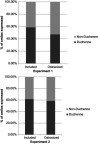
Table 4 Experiment 1 and Experiment 2 means across all codable emotion expression types