Figures & data
Figure 1 Participants were asked to slowdown their breathing rhythm to a particular rate by inhaling until the wave reached the highest mark on the device and exhale slowly while counting from 1 to 5 and watching for a triangle to appear above the wave, and start to inhale again as the next wave began to rise.
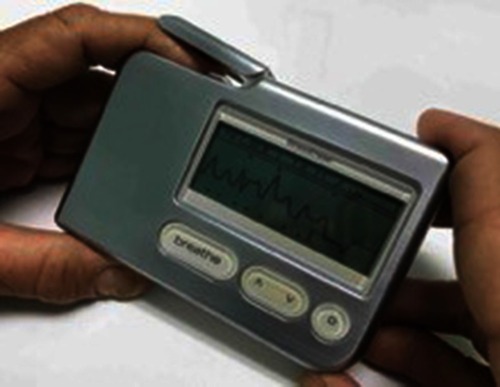
Table 1 Demographic characteristics (n=35)
Table 2 Alcohol-related consumption (n=35)
Figure 2 The bar graph shows the results of stress scores in the same group between the control and intervention group at baseline (striped bars), post-intervention (black bars) and follow-up (white bars).
Abbreviations: HRV, heart rate variability; PMK model, Phramongkutklao model.
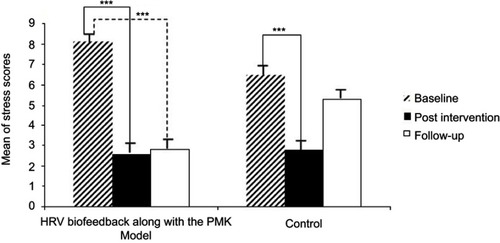
Figure 3 The bar graph shows the difference of stress scores among two group samples who received HRV biofeedback along with the PMK model (black bars) and the group who received only the PMK model (white bars) that were separately displayed at baseline, ∆Baseline-Post-intervention, ∆Baseline-Follow-up and ∆Post-intervention-Follow-up. e
Abbreviations: HRV, heart rate variability; PMK model, Phramongkutklaomodel.
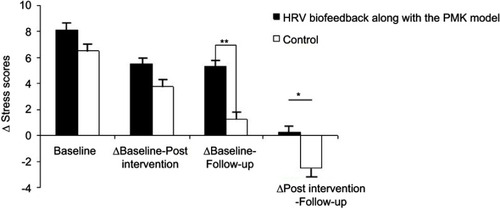
Figure 4 The bar graph shows the result of craving scores in the same group between the control and intervention group at baseline (striped bars), post-intervention (black bars) and follow-up (white bars).
Abbreviations: HRV, heart rate variability; PMK model, Phramongkutklao model.
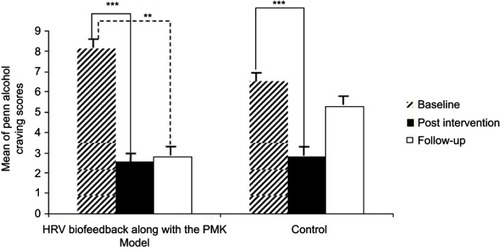
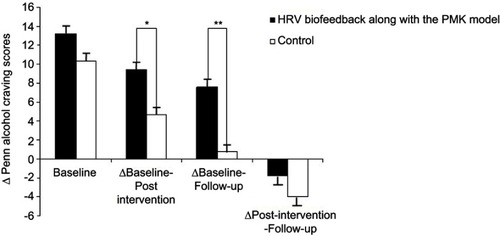
Figure 5 The bar graph showed the difference of craving scores among two group samples who received HRV biofeedback along with the PMK model (black bars) and the group who received only the PMK model (white bars) that were separately displayed at baseline, ∆Baseline-Post-intervention, ∆Baseline-Follow-up, and ∆Post-intervention- Follow-up.
Abbreviations: HRV, heart rate variability; PMK model, Phramongkutklao model.