Figures & data
Figure 1 Effect of Angiotensin II (ANG II) on hippocampal apoptosis. (A, B) Sirt3 mRNA expression was measured by RT-PCR in HT22 cells (HT22) and hippocampal tissues (Hippo), respectively. (C, D) Sirt3 protein expression was measured by Western blot in HT22 cells (HT22) and hippocampal tissues (Hippo), respectively. (E) Representative images of HT22 cells stained with JC-1 and the red/green fluorescence intensity ratio (scale bar=50 µm). (F) Representative images of TUNEL staining indicating apoptotic cells in the mice hippocampal tissues (scale bar=50 µm). (G) The expressions of apoptosis-related proteins measured by immunohistochemistry assay in the hippocampal tissues (scale bar=20 µm). (H) The expressions of apoptosis-related proteins measured by Western blot in HT22 cells. (I) Spatial navigation testing assay. (J) Spatial memory testing assay. The data are expressed as the means ± standard deviation (n=6 for each group) and asterisk (*) indicate a difference at P < 0.05.
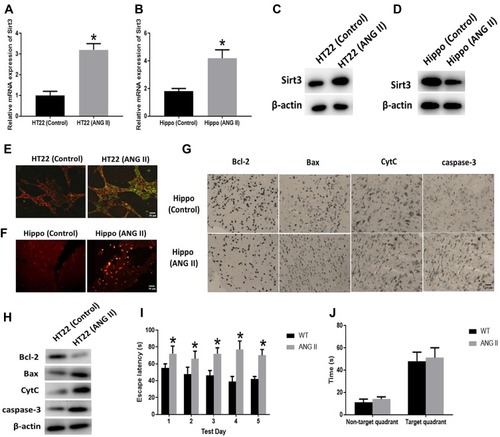
Figure 2 Effect of sirt3 on hippocampal apoptosis. (A) Sirt3 expressions were measured by Western blot and Sirt3/β-actin ratio. Negative Control (NC). (B) Sirt3 protein expression was measured in sir3-KO mice. (C) Representative images of HT22 cells stained with JC-1 and the red/green fluorescence intensity ratio (scale bar=50 µm). (D) Representative images of TUNEL staining indicating apoptotic cells in the mice hippocampal tissues (scale bar=50 µm). (E) The expressions of apoptosis-related proteins measured by immunohistochemistry assay in the hippocampal tissues (scale bar=20 µm). (F) The expressions of apoptosis-related proteins measured by Western blot in HT22 cells. (G) Spatial navigation testing assay. (H) Spatial memory testing assay. The data are expressed as the means ± standard deviation (n=6 for each group) and asterisk (*) indicate a difference at P < 0.05.
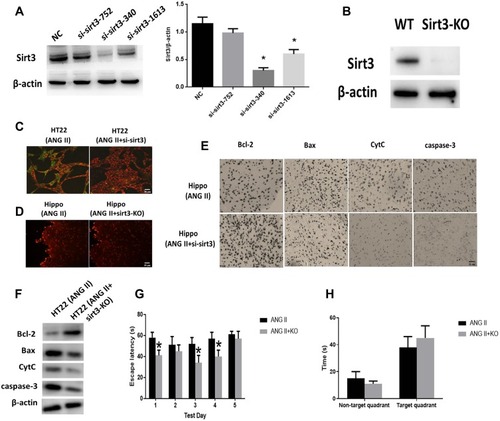
Figure 3 MiR-195 targeted 3ʹUTR of sirt3. (A, B) MiR-195 expression was measured by RT-PCR in HT22 cells (HT22) and hippocampal tissues (Hippo), respectively. (C) Prediction of the binding site of miR-195 in sirt3. (D) Luciferase assay. The data are expressed as the means ± standard deviation (n=6 for each group) and asterisk (*) indicate a difference at P < 0.05.
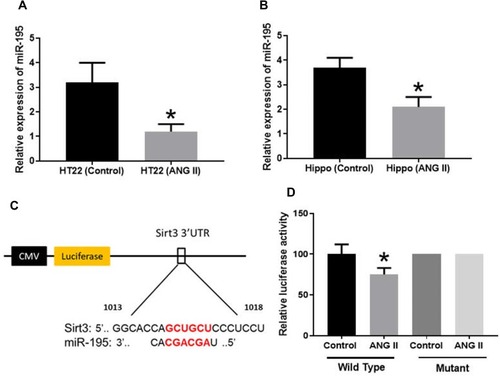
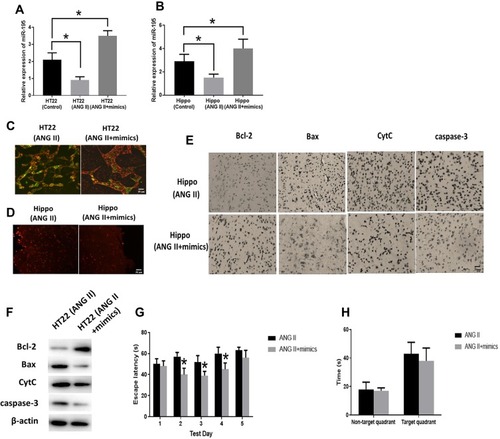
Figure 4 Effect of miR-195 on hippocampal apoptosis. (A, B) MiR-195 expression was measured by RT-PCR in miR-195 mimics-treated HT22 cells (HT22) and hippocampal tissues (Hippo), respectively. (C) Representative images of HT22 cells stained with JC-1 and the red/green fluorescence intensity ratio (scale bar=50 µm). (D) Representative images of TUNEL staining indicating apoptotic cells in the mice hippocampal tissues (scale bar=50 µm). (E) The expressions of apoptosis-related proteins measured by immunohistochemistry assay in HT22 cells (scale bar=20 µm). (F) The expressions of apoptosis-related proteins measured by Western blot in the hippocampal tissues. (G) Spatial navigation testing assay. (H) Spatial memory testing assay. The data are expressed as the means ± standard deviation (n=6 for each group) and asterisk (*) indicate a difference at P < 0.05.