Figures & data
Table 1 Characteristics Of The Children With ASD Included In The Study (mean ± SD)
Table 2 Correlation Between The CNBS-R2016 And Its Corresponding GDS-C Scales
Table 3 General And Subscale Quotients Of The GDS-C And CNBS-R2016 (mean±sd)
Table 4 Number Of Children With A Developmental Delay According To The General And Subscale Quotients Of The CNBS-R2016 And GDS-C (n, %)
Figure 1 ROC curve for discriminating children with ASD and developmental delay according to the CNBS-R2016 general or subscale quotient from those without a developmental delay using the GDS-C general or subscale quotient cut-off of 70 (mean −2 SDs) as a standard. (A) ROC curve of the CNBS-R2016 general quotient using the GDS-C general quotient cut-off of 70 as a standard. (B) ROC curve of the CNBS-R2016 gross motor quotient using the GDS-C subscale A quotient cut-off of 70 as a standard. (C) ROC curve of the CNBS-R2016 Personal-Social quotient using the GDS-C subscale B quotient cut-off of 70 as a standard. (D) ROC curve of the CNBS-R2016 Language quotient using the GDS-C subscale C quotient cut-off of 70 as a standard. (E) ROC curve of the CNBS-R2016 Fine Motor quotient using the GDS-C subscale D quotient cut-off of 70 as a standard. (F) ROC curve of the CNBS-R2016 Adaptive Behavior quotient using the GDS-C subscale E quotient cut-off of 70 as a standard.
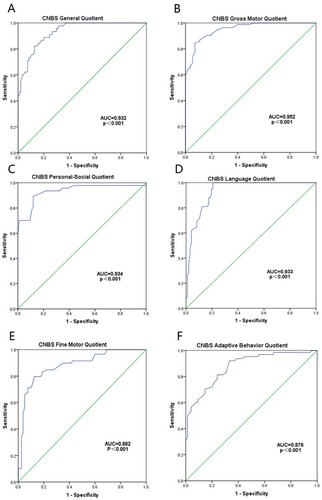
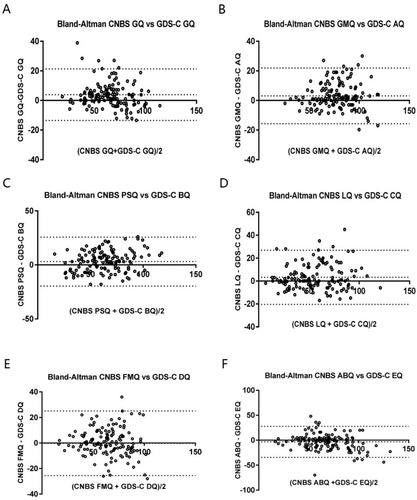
Figure 2 Bland-Altman plots generated to compare the average CNBS-R2016 and GDS-C quotients to their differences. The limits of agreement (95% CI, ie, mean ± 1.96 SDs) are shown by dotted lines. (A) Comparison of the CNBS-R2016 general quotient (GQ) and the GDS-C GQ. Mean difference: 3.9 (95% CI −13.5 to 21.3). (B) Comparison of the CNBS-R2016 Gross Motor quotient (GMQ) and the GDS-C subscale A quotient (AQ). Mean difference: 3.1 (95% CI −15.7 to 21.9). (C) Comparison of the CNBS-R2016 Personal-Social quotient (PSQ) and the GDS-C subscale B quotient (BQ). Mean difference: 3.1 (95% CI −19.6 to 25.7). (D) Comparison of the CNBS-R2016 Language quotient (LQ) and the GDS-C subscale C quotient (CQ). Mean difference: 3.3 (95% CI −20.4 to 26.9). (E) Comparison of the CNBS-R2016 Fine Motor quotient (FMQ) and the GDS-C subscale D quotient (DQ). Mean difference: −0.2 (95% CI −25.5 to 25.1). (F) Comparison of the CNBS-R2016 Adaptive Behavior quotient (ABQ) and the GDS-C subscale E quotient (EQ). Mean difference: −3.3 (95% CI −34.4 to 27.8).