Figures & data
Table 1 Demographic and Clinical Information of Surveyed Population (n=99)
Table 2 Mean TAS-20, PASI, and MGLS Scores of Surveyed Population
Table 3 Mean TAS-20 and Factor Scores According to Category of Alexithymia
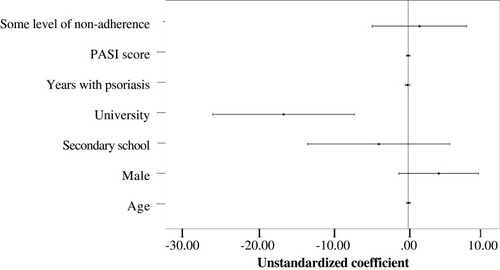
Figure 1 Regression coefficient plot with confidence intervals of standard multiple regression. Regression coefficients’ names are placed in the Y-axis and their corresponding values express how they increase/decrease the TAS-20 score. Reference category for gender was “female”; reference category for education level was “no education”; reference category for level of adherence was “some level of non-adherence”.