
Figures & data
Table 1 Demographic Characteristics of the Sample
Figure 1 The examples of high caloric (First line) and low caloric food (Second line).
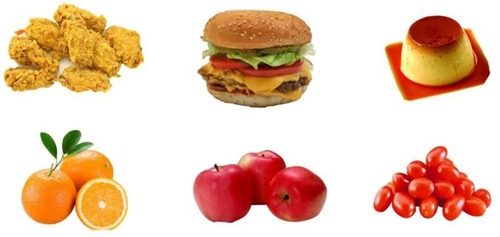
Figure 2 An example of a trail.
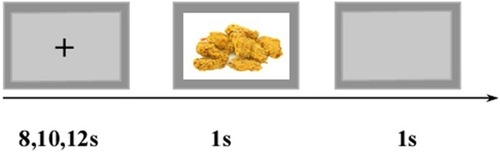
Figure 3 Brain activation when viewing highly caloric food stimuli. Color-coded areas represent activation in restrained eaters (red) and unrestrained eaters (blue). Upper limit z score (represented by color-coded bars) was used to portray activated areas.
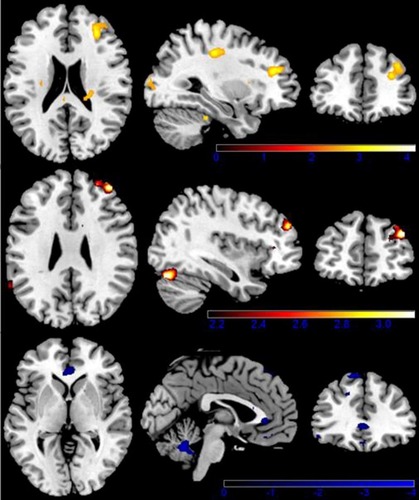
Table 2 Local Maxima During Participants Judged the Pictures in the Whole Brain Under High-Caloric Condition. Regions are Shown for the Contrast Conditions at P<0.001 with an Extent Threshold of 10 Voxels Among Participants
Table 3 Local Maxima During Participants Judged the Pictures in the Whole Brain Under Low Caloric Condition. Regions are Shown for the Contrast Conditions at P<0.001 with an Extent Threshold of 10 Voxels Among Participants