
Figures & data
Table 1 Demographic Characteristics of the Sample
Table 2 Descriptive Statistics in the Total Sample (N = 914)
Table 3 Means, Standard Deviations, and Two-Way ANOVA Statistics for Study Variables
Figure 1 Mean values of standardized Z-scores for satisfaction with life, perceived stress, general anxiety disorder, task-, emotion-, and avoidance-oriented coping,styles in a five groups of students representing self-rated current health status in comparison to the situation before coronavirus COVID-19 outbreak, as ranged between 1 = Much better to 5 = Much worst. Error bars represent 95% CI.
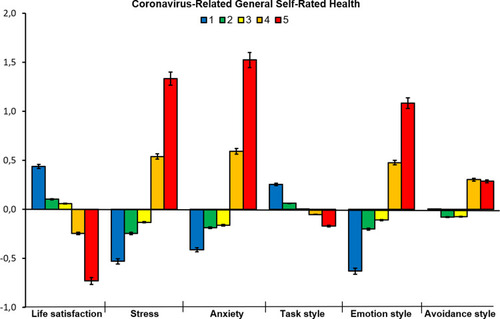
Table 4 Correlation Matrix Between All Variables
Table 5 Hierarchical Regression Results for Perceived Stress