
Figures & data
Table 1 DASS-21 Test Assessment Score
Figure 1 The image shows the administration of the NPPO-CB treatment. (A) Device based on REAC technology, model BENE 110 (ASMED, Florence, Italy); (B) Asymmetric conveyer probe (ACP). The ACP is connected to device (A) via a specific connection cable (C). The ACP is held in place using an elastic tubular mesh (D).
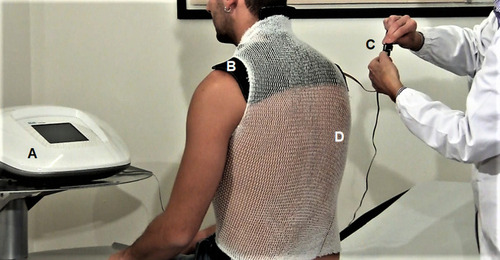
Figure 2 Graph of distribution of participants by severity level before and after REAC NPO, and NPPO-CB treatments for the depression cluster.
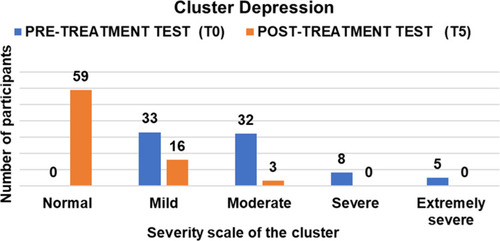
Figure 3 Graph of distribution of participants by severity level before and after REAC NPO, and NPPO-CB treatments for the anxiety cluster.
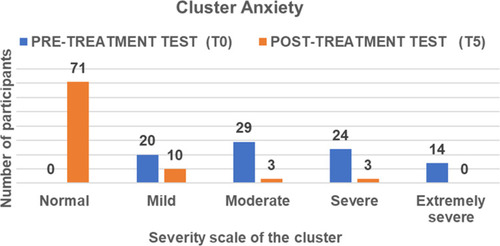
Figure 4 Graph of distribution of participants by severity level before and after REAC NPO, and NPPO-CB treatments for the stress cluster.
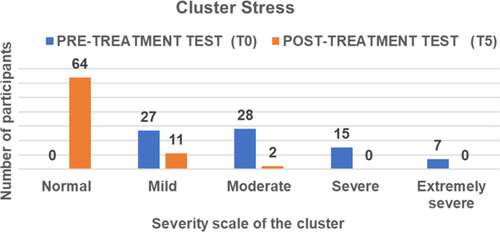
Figure 5 Group of the participants positive to DASS-21 test. The graph shows the improved values, moving towards the lower threshold of the normal range in all three clusters, before and after REAC NPO, and NPPO-CB treatments.
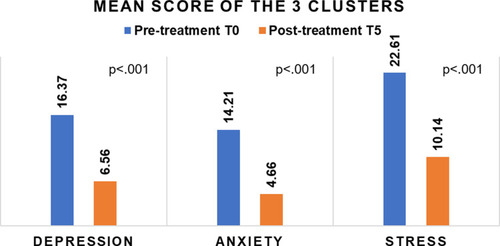
Figure 6 Group of the participants negative to all three clusters of DASS-21 test. The graph shows the improved values, moving towards the lower threshold of the normal range in all three clusters, before and after REAC NPO, and NPPO-CB treatments.
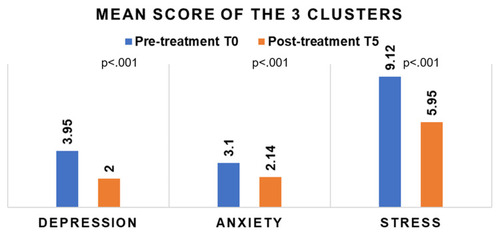
Table 2 Statistical Analysis – Sign Test and Wilcoxon Test