Figures & data
Figure 1 Theoretical framework. The study theoretical framework. It is a graphical representation of the proposed hypothesis H1 to H5. Self-reported sensation seeking is the independent variable, self-reported driving style is the mediating variable, driving emotion is the moderating variable, and actual risky driving behavior is the dependent variable.
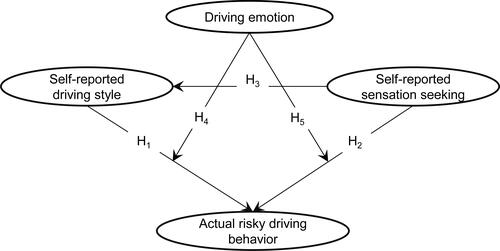
Figure 2 Experiment procedure. The procedure of data collection experiments. The participants’ data on self-reported driving style and self-reported sensation seeking were obtained through questionnaires. The participants’ data on actual risky driving behaviors in eight driving emotional activation states were obtained through a series of emotion induction experiments and driving experiments.
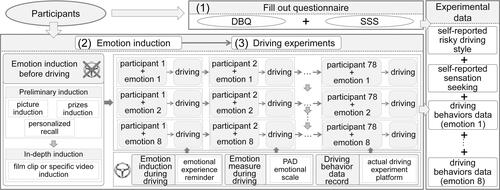
Figure 3 Experimental vehicle, speedometer and pedal force meter. The equipment used in the driving experiment. The experimental equipment included experimental vehicle, SG299 GPS noncontact multifunction speedometer and WTC-1pedal force meter. The speedometer was composed of GPS external antenna and host. In the experiment, the GPS antenna was placed on the ceiling outside the vehicle, and the host was placed inside the vehicle. The force pedal consisted of a force measuring instrument and a data storage device. In the experiment, the force measuring instrument needed to be fixed on the accelerator pedal.
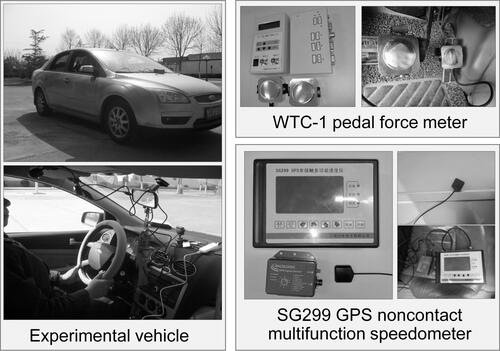
Figure 4 Driving experimental route. The route of driving experiment. The experimental route was a road section of Binlai expressway locating in Zibo city. The length of the experimental route was about 23 kilometers. The expressway had a speed limit of 120 km/h. Points TS1 and TS2 were two toll stations on the expressway.
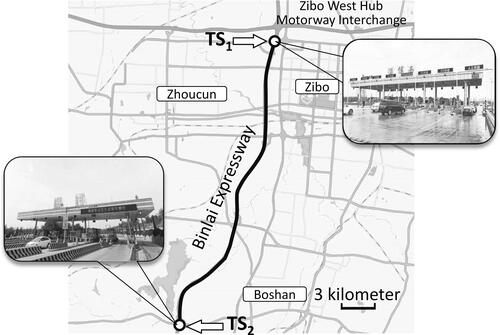
Figure 5 Coordinate of anxiety in PAD scale. The coordinate of anxiety in PAD scale. The PAD scale was composed of three dimensions: Pleasure-displeasure (P), Arousal-nonarousal (A) and Dominance-submissiveness (D). Each dimension was noted from 0 to 100 based on the strength of each dimension in this study. In the adapted PAD scale, the coordinate of anxiety was P=38, A=54, D=42.
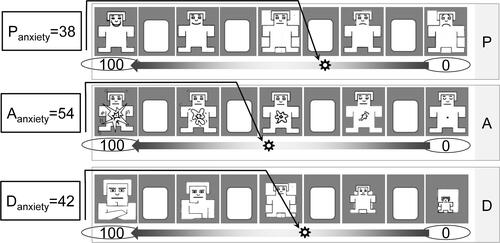
Table 1 Descriptive Statistics for the Data of Self-Reported Individual Traits
Table 2 Descriptive Statistics for Driving Behavior Data Under Different Emotional States
Figure 6 Form of CFA model. The form of Confirmatory Factor Analysis (CFA) model. In the CFA model, the emotion represented one of the eight emotions. The one-way relationships between LVs and their corresponding MVs were established and the LVs were interconnected in pairs.
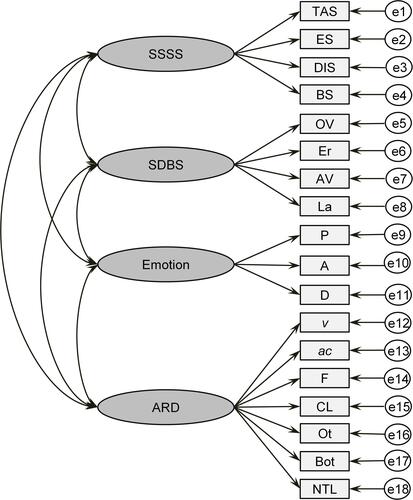
Figure 7 Form of structural model. The form of structural model. The structural models represented the relationships of SSSS, SDBS, emotion and ARD. Due to the present study involved the moderating effect of latent variables, the interaction variables Dint and Sint that characterized the moderating effects in the structural equation were needed. The Dint and Sint were latent variables and the method of the matching product was applied to generate their MVs.
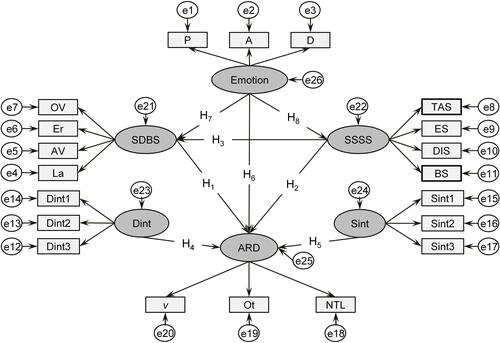
Table 3 The Values of Fitness Evaluation Index in Each Structural Equation Model
Table 4 Significance Test of Path Coefficients Between LVs in the SEM Applicable to Anger
Figure 8 Fitted SEM applicable to anger. The fitted SEM that adapting to anger constructed in AMOS software. Compared with the original theoretical model, many two-way paths were added between different variables in the fitted model. The purpose of adding these paths was to better match the experimental data with the model. In the fitted model, the path coefficients were used to determine whether the proposed hypothesis is supported.
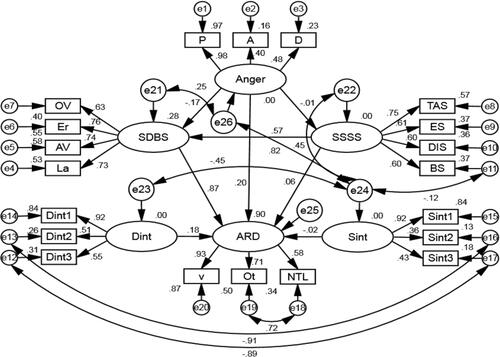
Table 5 Significance Test of Path Coefficients Between LVs in the SEM Applicable to Surprise
Figure 9 Fitted SEM applicable to surprise. The fitted SEM that adapting to surprise. Compared with the original theoretical model, many two-way paths were added between different variables. In the fitted model, the path coefficients were used to determine whether the proposed hypothesis is supported.
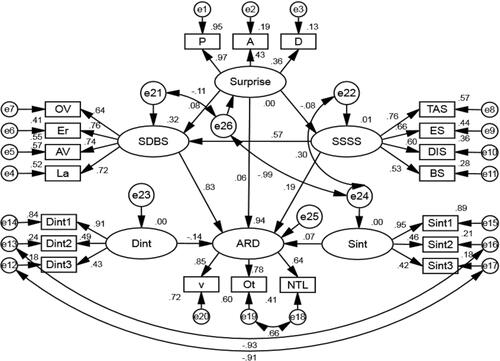
Table 6 Significance Test of Path Coefficients Between LVs in the SEM Applicable to Fear
Figure 10 Fitted SEM applicable to fear. The fitted SEM that adapting to fear. Compared with the original theoretical model, many two-way paths were added between different variables. In the fitted model, the path coefficients were used to verify the proposed hypothesis.
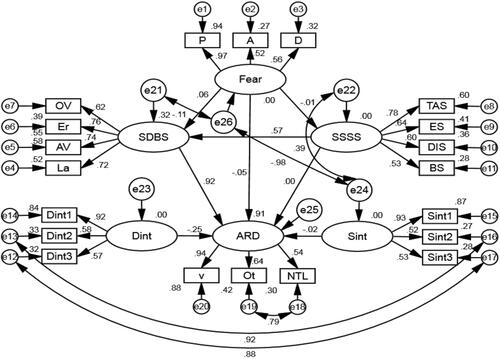
Table 7 Significance Test of Path Coefficients Between LVs in the SEM Applicable to Anxiety
Figure 11 Fitted SEM applicable to anxiety. The fitted SEM that adapting to anxiety. Compared with the original theoretical model, many two-way paths were added between different variables. In the fitted model, the path coefficients were used to verify the proposed hypothesis.
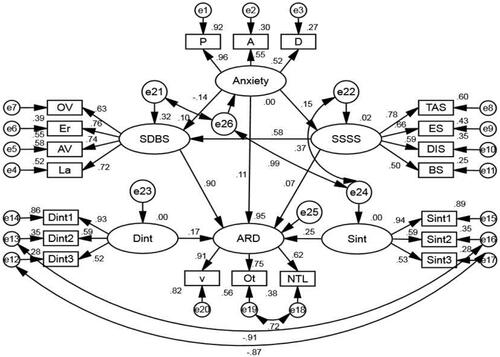
Table 8 Significance Test of Path Coefficients Between LVs in the SEM Applicable to Helplessness
Figure 12 Fitted SEM applicable to helplessness. The fitted SEM that adapting to helplessness. Compared with the original theoretical model, many two-way paths were added between different variables. In the fitted model, the path coefficients were used to verify the proposed hypothesis.
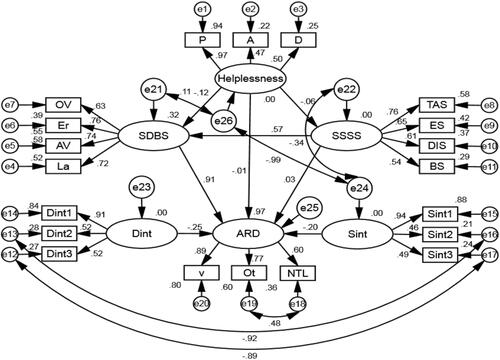
Table 9 Significance Test of Path Coefficients Between LVs in the SEM Applicable to Contempt
Figure 13 Fitted SEM applicable to contempt. The fitted SEM that adapting to contempt. Compared with the original theoretical model, many two-way paths were added between different variables. In the fitted model, the path coefficients were used to determine whether the proposed hypothesis is supported.
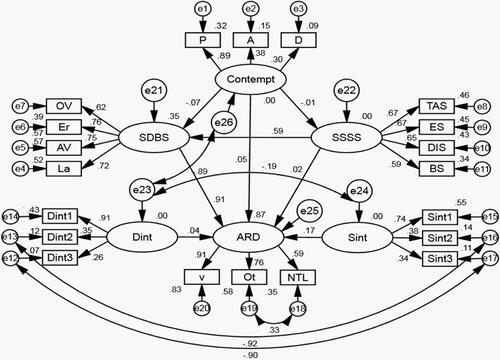
Table 10 Significance Test of Path Coefficients Between LVs in the SEM Applicable to Relief
Figure 14 Fitted SEM applicable to relief. The fitted SEM that adapting to relief. Compared with the original theoretical model, many two-way paths were added between different variables. In the fitted model, the path coefficients were used to determine whether the proposed hypothesis is supported.
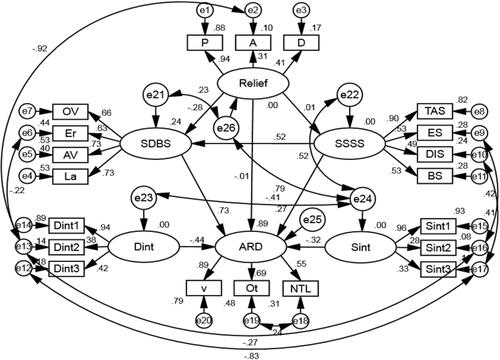
Table 11 Significance Test of Path Coefficients Between LVs in the SEM Applicable to Pleasure
Figure 15 Fitted SEM applicable to pleasure. The fitted SEM that adapting to pleasure. Compared with the original theoretical model, many two-way paths were added between different variables. In the fitted model, the path coefficients were used to verify the proposed hypothesis.
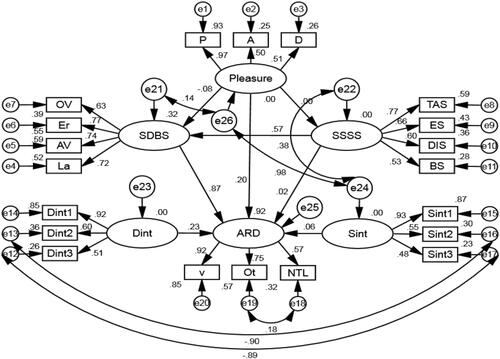
Figure 16 Path coefficients from SSSS to SDBS, from SDBS to ARD, and from SSSS to ARD in different SMEs. The path coefficients from SSSS to SDBS, from SDBS to ARD, and from SSSS to ARD in the SMEs applicable to different driving emotions. ***Indicated that the path coefficient was significant at the level of 0.01, **Indicated that the path coefficient was significant at the level of <0.05, *Indicated that the path coefficient was significant at the level of <0.1.
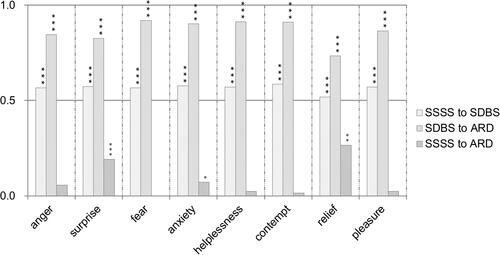
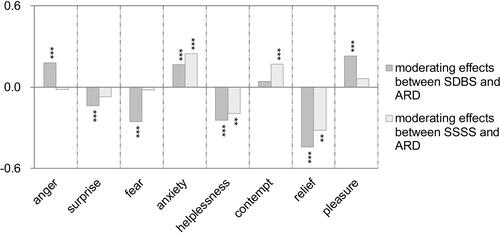
Figure 17 Moderating effects of different driving emotions on the influencing paths from SDBS to ARD and from SSSS to ARD. The moderating effects of different driving emotions on the paths from SDBS to ARD and from SSSS to ARD. ***Indicated that the path coefficient was significant at the level of 0.01, **Indicated that the path coefficient was significant at the level of <0.05.