
Figures & data
Figure 1 Research theoretical model.
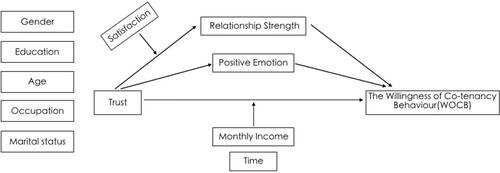
Table 1 Variables Measurement Scale
Table 2 Sample Reliability Analysis
Table 3 Samples Validity Analysis
Table 4 Pearson Correlation Between Variables (N=525)
Table 5 Results of Hierarchical Regression Analysis Between Variables (n=525)
Table 6 Analysis of Regulatory Effect Results-Monthly Income (MI) (n=525)
Figure 2 Simple slope diagram of the regulatory of monthly income.
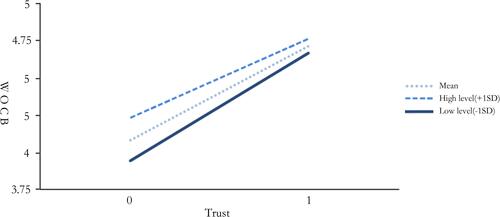
Table 7 Analysis of Regulatory Effect Results-DOC (n=525)
Table 8 Analysis of Regulatory Effect Results-Satisfaction (n=525)
Table 9 Test of the Mediating Effect: PE and RS
Figure 3 Research theoretical model (Final).
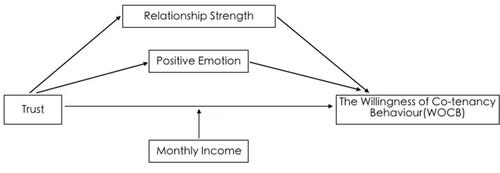
Table 10 The Number of Factor
Table 11 AVE and CR Index Results in the Model a
Table 12 Summary Table of Model Regression Coefficient
Table 13 The Result of Measurement Expression Relationship
Table 14 Fitting Index of Structural Model