Figures & data
Figure 1 The proposed moderated mediating model.
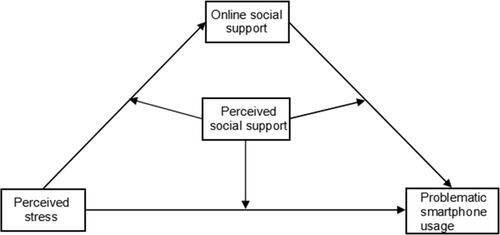
Table 1 The Participants’ Background Characteristics (N=1123)
Table 2 Descriptive Statistics and Correlations Between Variables
Table 3 Bootstrapping Indirect Effects and 95% Confidence Intervals (CI) for the Mediation Model
Table 4 Testing the Moderated Mediation Effect of Perceived Stress on Mobile Phone Addiction
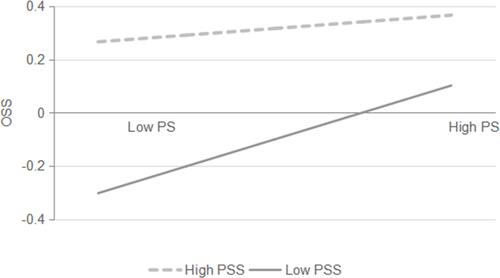
Figure 2 Interaction between PS and PSS on online social support.
Abbreviations: PS, perceived stress; OSS, online social support; PSS, perceived social support.