
Figures & data
Table 1 Comparison of Trends in Neurodevelopmental Disorders and Neurotoxins in the General Environment in the United States Between 1992 and 2003Citation1
Figure 1 Comprehensive diagram of prevalence of Autism & ADHD and the amount of different kinds of neurotoxins in the United States between 1990 and 2007. Reproduced from Smith EE, Charest JM, Bedrosian KR, DeVault VL Neurotoxic chemicals in the environment. 2008.Citation1
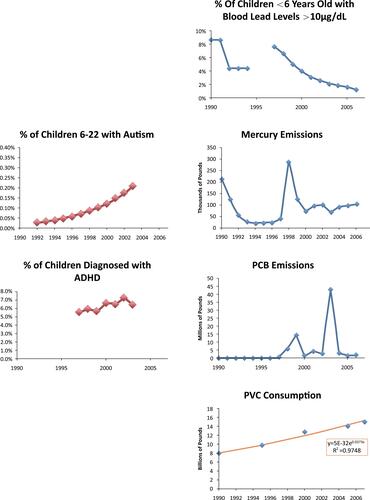
Table 2 Comparison of Monoamine Neurotransmitters NE and 5-Ht in Blood of ADHD and Autism Children with Normal Infants ( ± s)