Figures & data
Figure 1 Self-determination continuum based on Deci and RyanCitation13 and Vallerand et al.Citation14
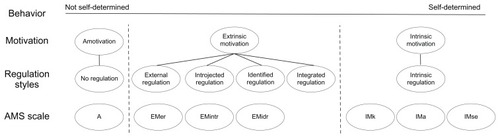
Table 1 Item analysis and descriptive statistics of the high school sample
Table 2 Item analysis and descriptive statistics of the college sample
Table 3 Goodness-of-fit indexes obtained by ULS
Table 4 Standardized factorial weights obtained by bootstrap
Table 5 Correlations between factors obtained by bootstrap
Figure 2 High school sample: estimated parameters.
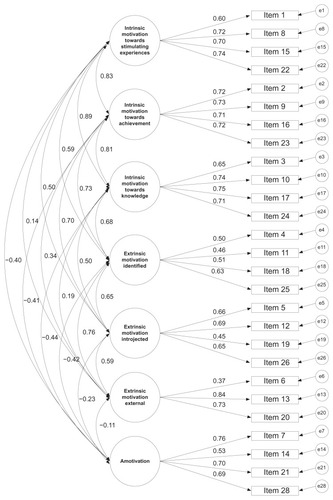
Figure 3 College sample: estimated parameters.
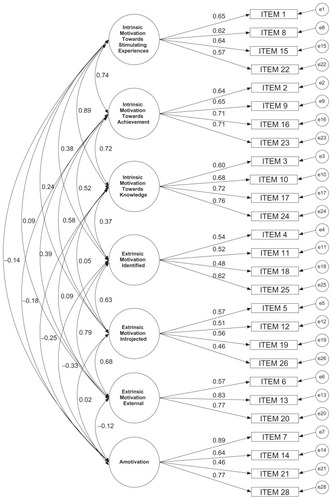
Table 6 Internal consistency for dimensions
Table 7 Differences in motivational types according to educational level
Appendix 1 Academic Motivation Scale: high school version (in Argentine Spanish)
Appendix 2 Academic Motivation Scale: college version (in Argentine Spanish)